ORACLE PRIMAVERA UNIFIER
DOWNLOAD THE PDF HERE
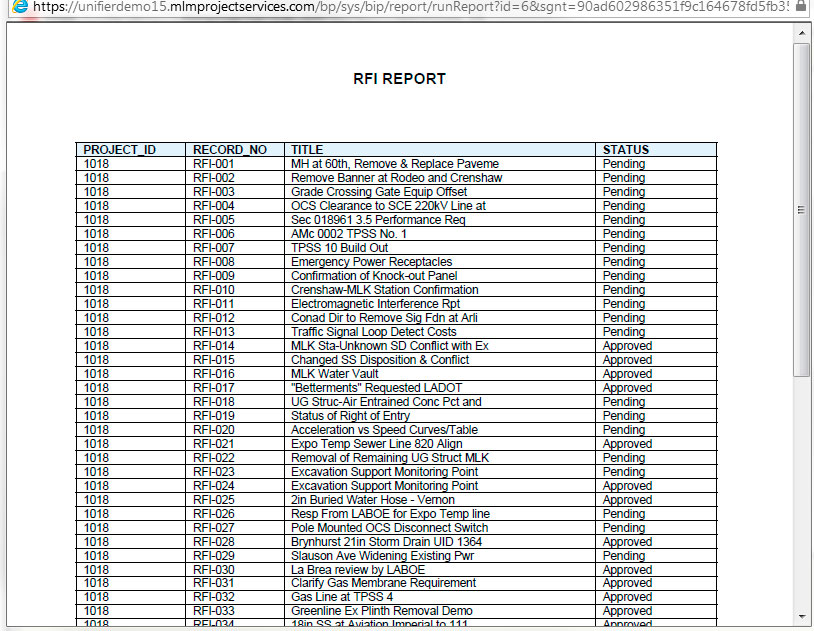
A custom report provides the flexibility to create high quality reporting within Unifier. The following steps outline how to publish a custom report. The custom report requires a Data View to extract the data and a design layout for the presentation layer. In this example we are looking at a simple custom report which lists the RFIs for a project.
1. SELECT THE DATA VIEW
Data Views allow the user to create data sources which can be used in UDRs, custom reports and shell dashboards.
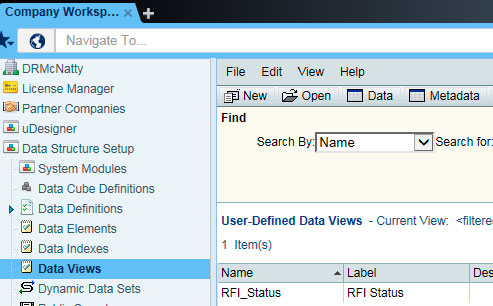
This example has a Data View already created called ‘RFI_Status’. Data Views are found by going to the Company Workspace > Data Structure Setup> Data Views node. For more information on how to create a Data View please refer to December’s Tech Tip: How to Use A Data View in a UDR.
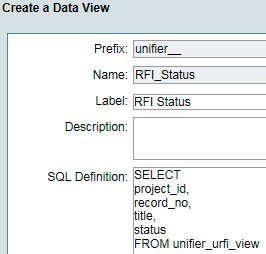
Opening the Data View will show the SQL query that retrieves RFI data.
Ensure the Data View is published.

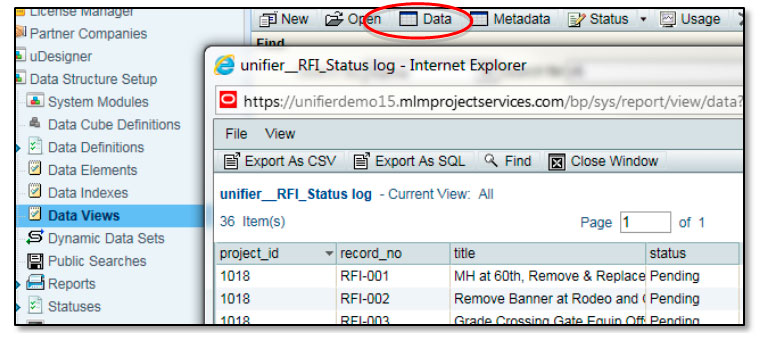
To test that the Data View is retrieving information correctly, select the Data View record and click the ‘Data’ button from the Data Views menu. A window will display with the result set. If all looks good, then close the window. If the output is incorrect, you’ll need to return to the Data View setup to modify.
2. INITIATE REPORT AND GENERATE XML
The next step will be to create the custom report which can generate a sample XML data file. This XML file will be used in BI Publisher Desktop for Word to create the layout.
Go to Company Workspace > Configuration > Custom Prints and Reports node.
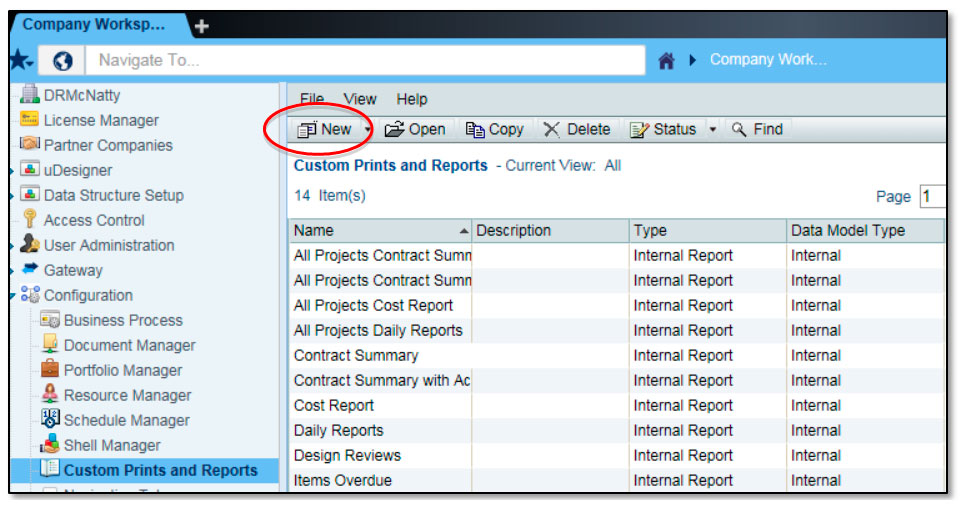
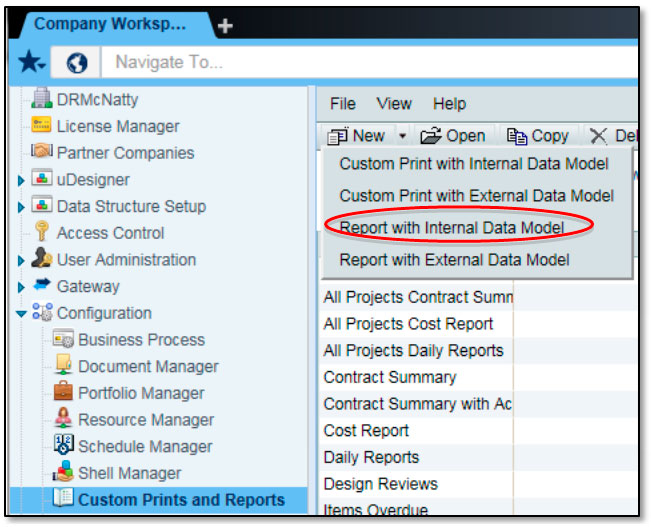
Click ‘New’ and select “Report with Internal Data Model” option.
Note: This example will create a ‘Report with Internal Data Model’. The selected option will allow Unifier to handle the Data Model internally for any changes. If ‘Report with External Data Model’ was selected then the Data Model is managed externally through an XDM file (modified within BI Publisher). “Custom Print…” options are used to generate a single “document” type form, not a summary report.
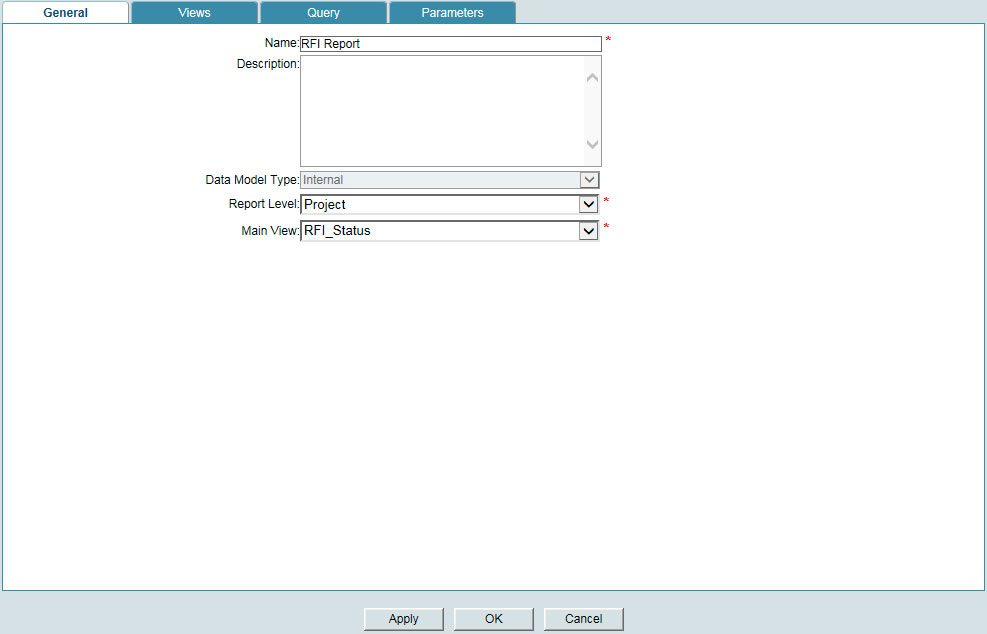
The report window is displayed. Enter Name of the report and select Report Level and Main View values from the drop down.
The Report Level is either ‘Program’ or ‘Project’ determined by which level the report will be run. This example is run at the project-level.
The Main View will display a list of all published Data Views available. This example, RFI_Status is selected.
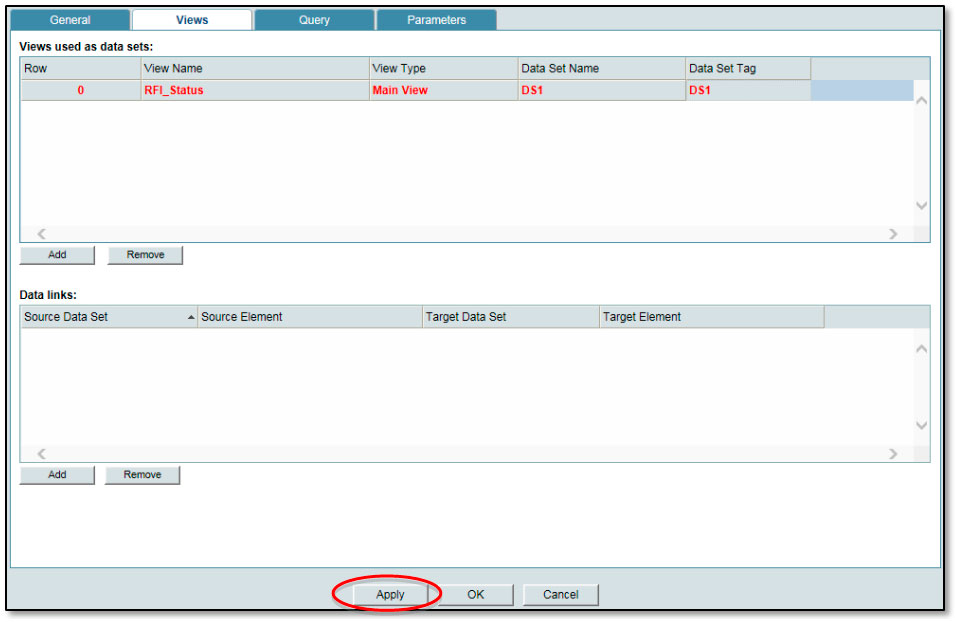
In the View tab click the ‘Add’ button for the ‘Views used as data sets’ section. In the View Name column select the same Data View. View Type should remain as the ‘Main View’ and enter an appropriate Data Set Name which will also populate the Data Set Tag column.
If your report uses multiple data sets, you would use the bottom section “Data Links” to create the linking or association between the data sets, but as this report has only one data set, leave this section blank.
Similarly, this example has no query conditions or parameters to include. Their tabs do not need to be modified.
Click the ‘Apply’ button.
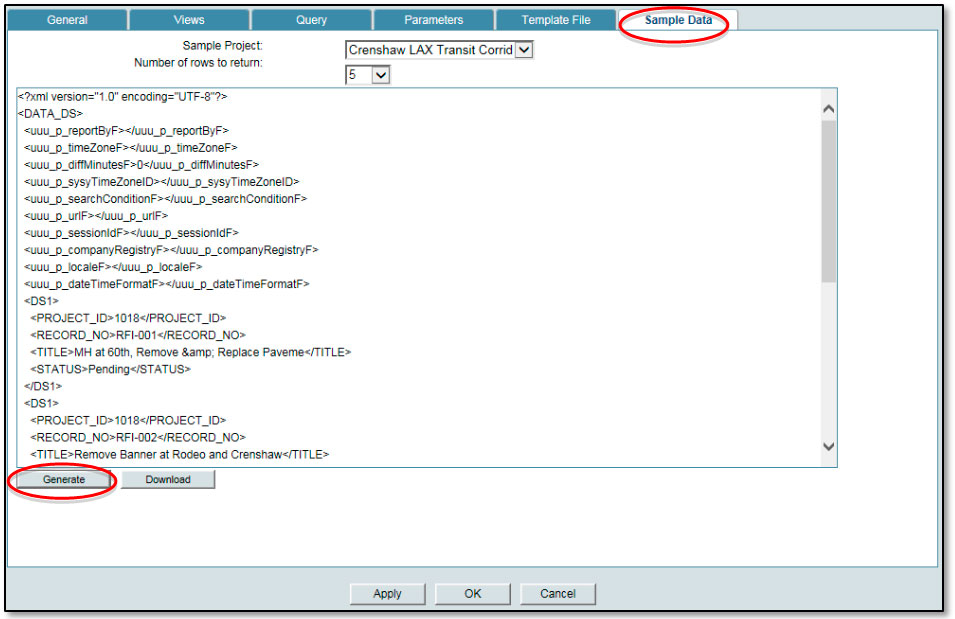
Clicking ‘Apply’ will result in two new tabs being displayed, the Template File tab and Sample Data tab. Select the Sample Data tab to download the XML data that will be used to create the report design layout.
Select a project from the Sample Project pulldown list and select the number of sample records to bring back (this example is selected for 5 but the other options are 10, 50 or 100) and click the ‘Generate’ button.
Once data (in XML format) is displayed click the ‘Download’ button to save the XML data file to an appropriate location.
3. CREATE REPORT LAYOUT IN BI PUBLISHER DESKTOP
Next you will be working in Oracle Business Intelligence to create the report layout. This runs inside MS Word. If the BI Publisher Desktop for Word Plug-In has not been installed in MS Word, go to https://www.oracle.com/technetwork/middleware/bi-publisher/downloads/index.html to download and install.
Once installed, the plug-in creates a new Bi Publisher tab in MS Word.

Click the ‘Sample XML’ folder icon to load the XML file downloaded from Unifier.
This example will use the Table Wizard (found in the BI Publisher toolbar) to create the report design layout.
Note: Once you are comfortable, you can also use the other BI Publisher commands to create more complex custom reports.
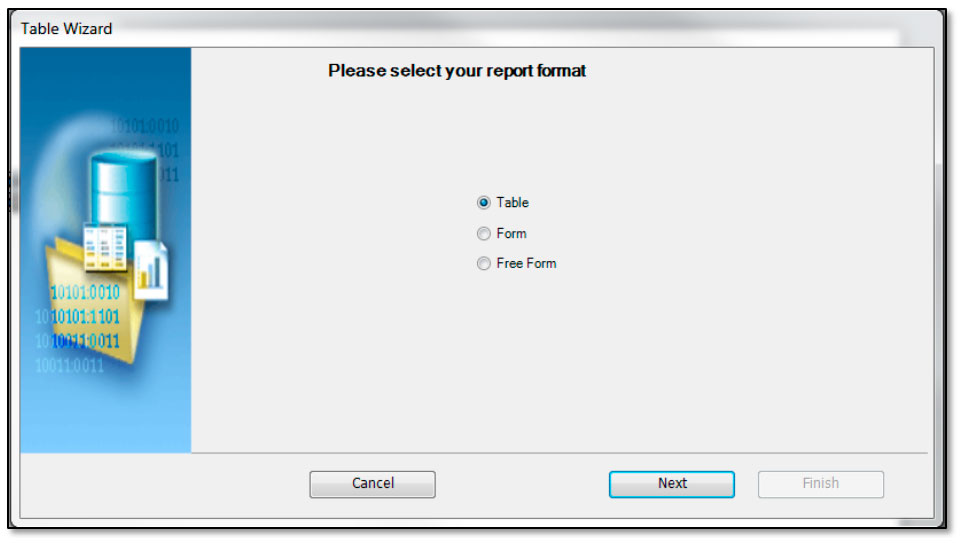
Select Table and click ‘Next’.
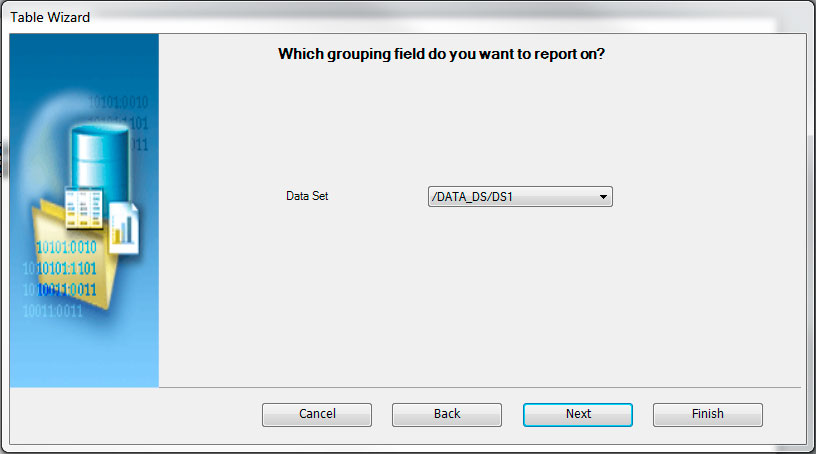
Keep the Data Set selection the same (this is automatically read from the uploaded XML file) and click ‘Next’.
Select all fields from the left hand pane and click ‘>>’. This will display all those fields in the report as columns.
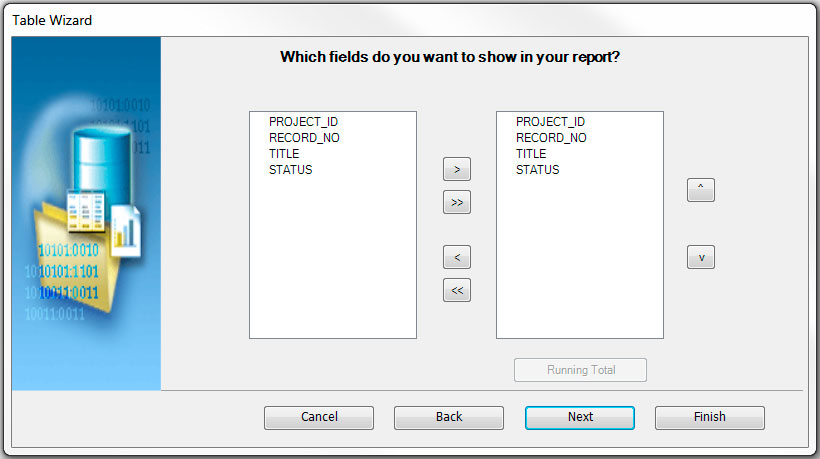
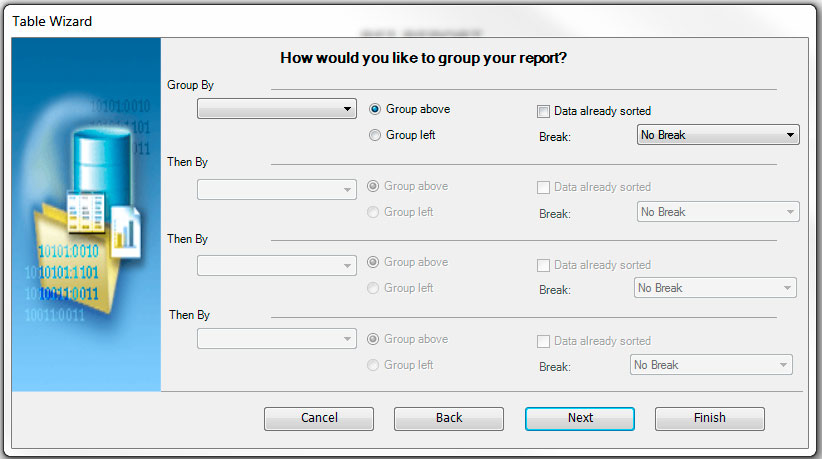
Click ‘Next’ in this window since there is no grouping requirement for this report.
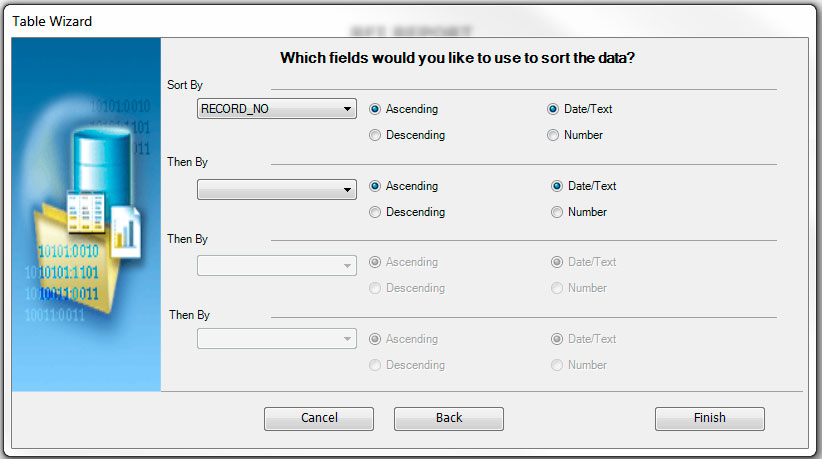
Sort data by Record_No and in Ascending order, then click ‘Next’.
The Table Wizard automatically creates a table with the selected fields and column headings.
The design layout should now be saved in RTF format. This can be done through the File > ‘Save As’ option of Word, however, another option is to preview the report first (using the uploaded XML data).
The best option is to click the ‘Preview’ button and select the PDF option. This will automatically prompt you to save in RTF format. If you select File > Save As option, make sure you select the Rich Text (RTF) document type and NOT a standard Word (DOC, DOCX) format.
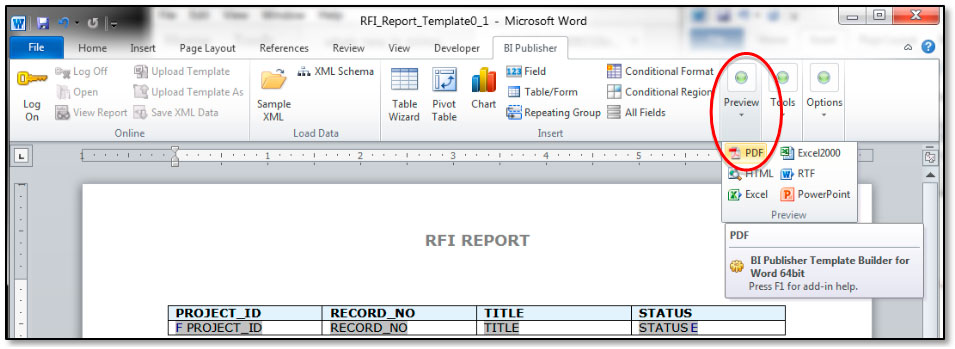
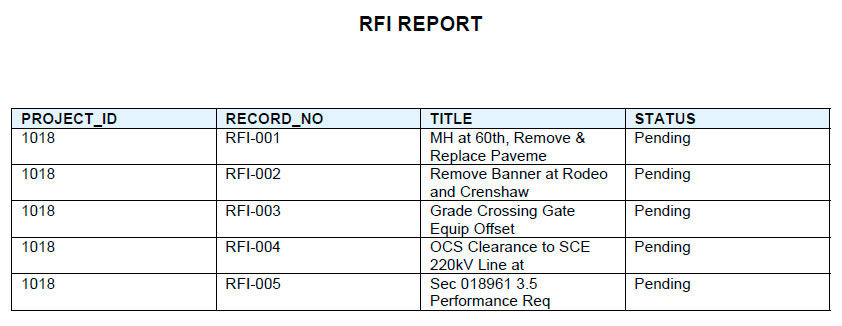
After saving the design layout in RTF format, the preview PDF window will display.
4. UPLOAD RTF LAYOUT TO UNIFIER
The RTF file can now be uploaded into the custom report in Unifier.
Go back to the report in Company Workspace > Configuration > Custom Prints and Reports node.
Open the report and select the Template File tab and click ‘Add’ button.
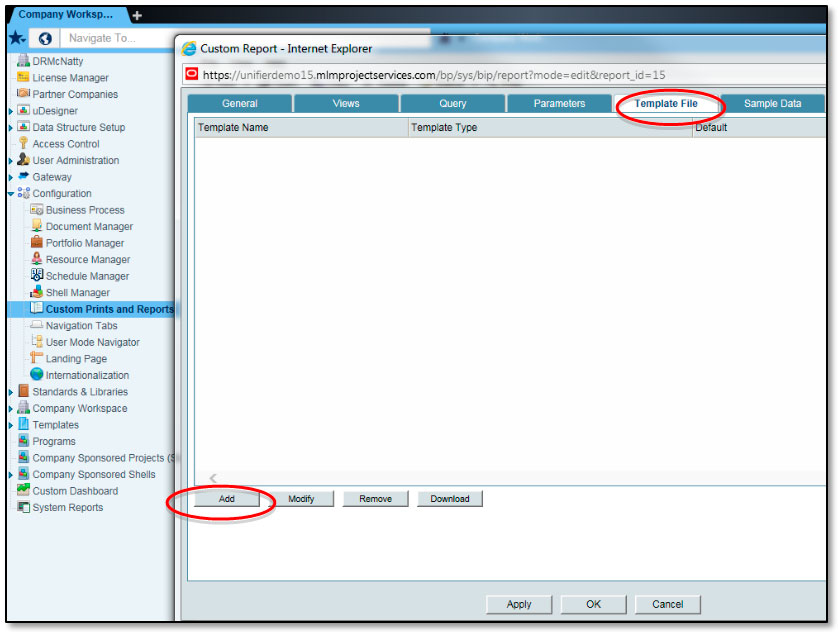
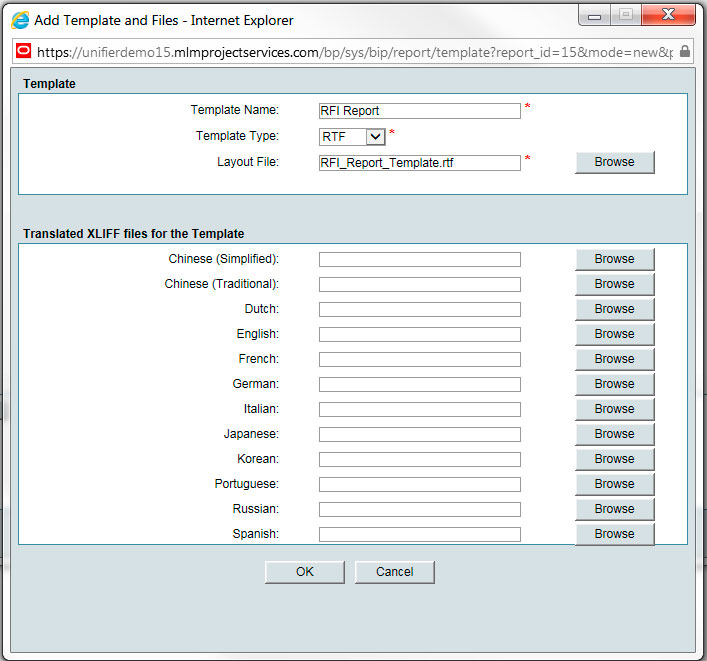
In the Add Template and Files window, enter a Template Name. Note: This is the description the user sees.
Select RTF Template Type and locate the RTF file using the ‘Browse’ button. Click ‘OK’ on this window and the previous one.
5. PUBLISH THE REPORT
Selecting the report record, publish the report using the ‘Status’ button.

6. MAKE REPORT AVAILABLE IN USER MODE
Once the report is published, it has to be made available in Unifier User Mode.
Go to Company Workspace > Configuration > User Mode Navigator node and open the Project/Shell record (this is the Project/shell navigator).
The report is seen in the available list of Available Modules and Business Processes.
Use the left arrow icon to move the report into an appropriate User Mode node. This example will move the report into the default Reports node.
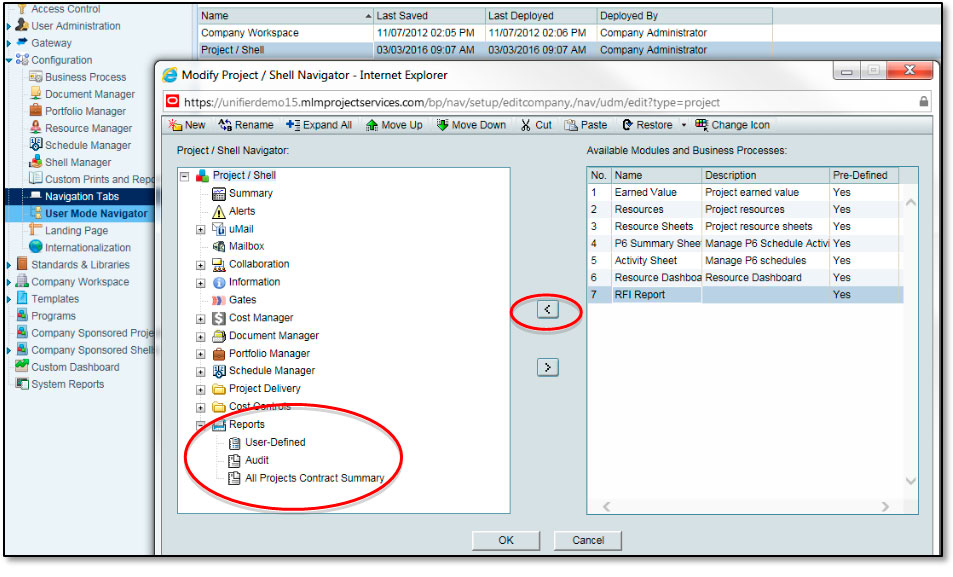
The report is now under the Reports node. Click ‘OK’.
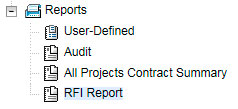
After selecting the Project/Shell record click ‘Deploy’ to make the change available in User Mode.

7. SET PERMISSIONS FOR THE REPORT
The final step is to add the permissions for the report in the appropriate project. This will be completed by using the Shell Template to push the changes to the project.
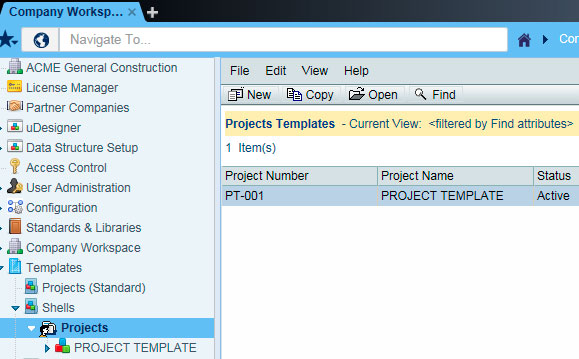
Go to Company Workspace > Templates > Shells to locate the shell template to use.
Open the shell template.
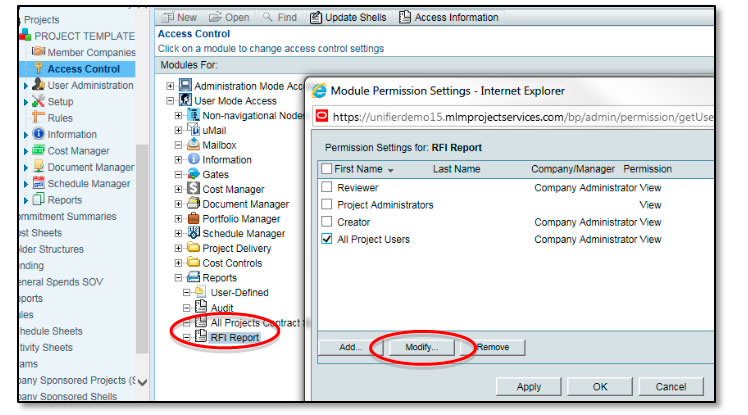
Select the Access Control node of the shell template and locate the report from the Reports node.
Note: Log out and then log back in if the report cannot be initially seen in the Reports node.
Select the report and a Permissions Settings window will appear.
Check the Group(s) required to access the report and click ‘Modify’.
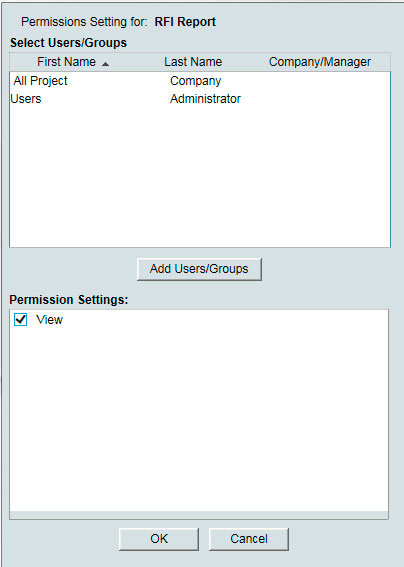
In the new window check the View setting and click ‘OK’.
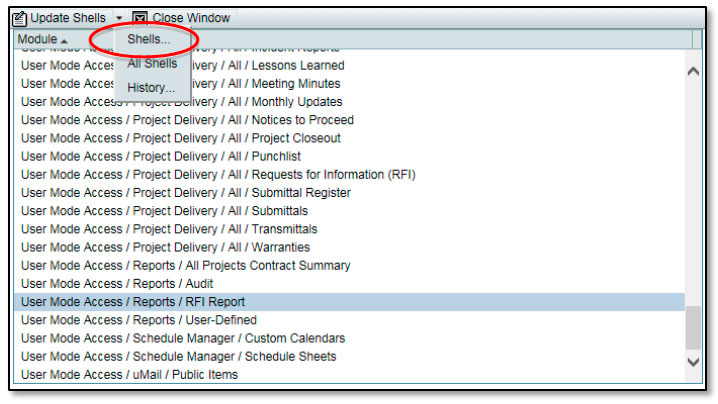
Click ‘Update Shells’ to open up the module permission list. Locate and select the User Mode Access for the ‘RFI Report’.
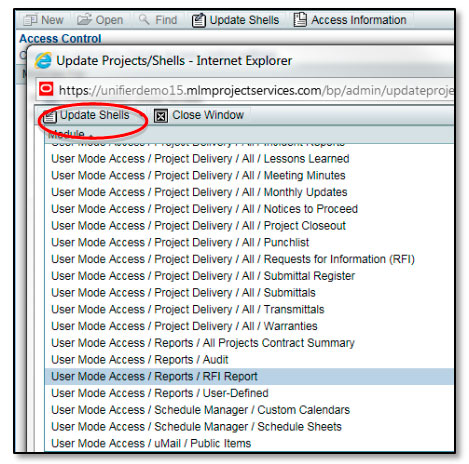
Click ‘Update Shells’ > Shells… from this window.
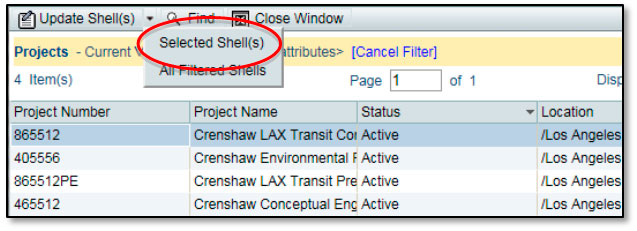
Select the project(s) this report will appear in and click ‘Update Shell(s)’ > Selected Shells from projects list window.
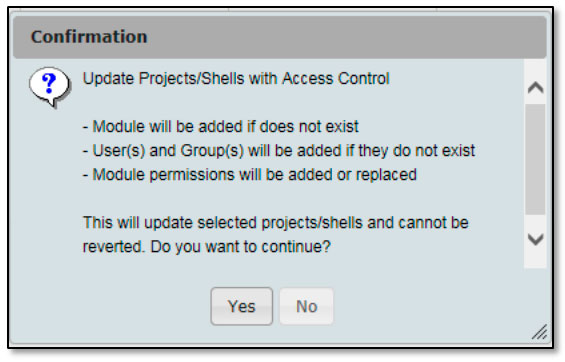
Click ‘Yes’.
8. TEST REPORT PRINTING
The report now should be available and ready to test.
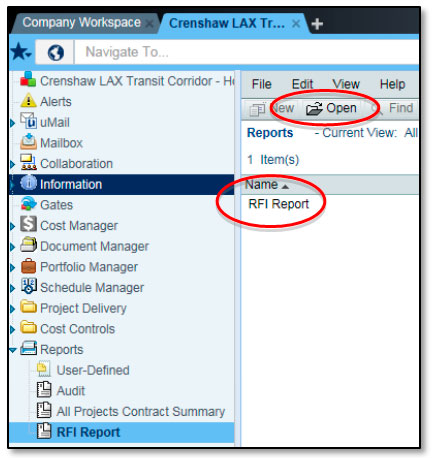
Go to the project in User Mode and select the Reports node. Select the report and click ‘Open’.
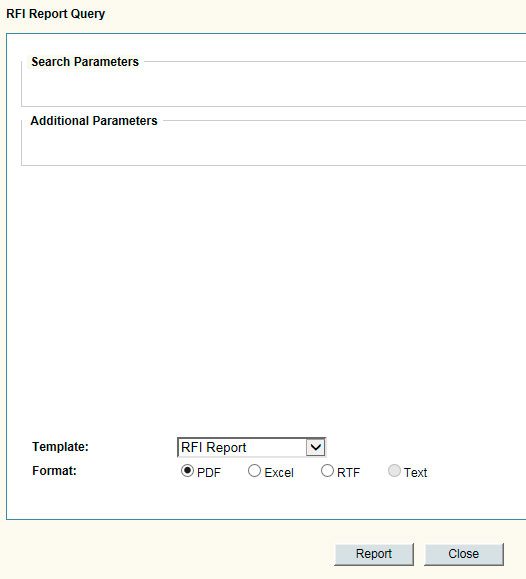
The report query window now appears. The template uploaded has already been selected. Choose pdf for the format. Click the ‘Report’ button to run the report.
Note: The Search Parameters and Additional Parameters sections are blank since query conditions and additional parameters were not included.
The report will display in PDF format once the data has been retrieved. The report can now be saved or printed.
Note: You may also output reports in other formats (i.e. Excel, RTF, Text) depending upon your needs. Also in this example, we built ONE layout template for the report; however, you also have the option to build multiple layouts for the same base report should the layout needs change for different users/projects.
