BI PUBLISHER
DOWNLOAD THE PDF HERE
OVERVIEW
There are several methods to organize, display and group your information in a BI report. We’ll cover these in the document below:
- Header/Footers in report
- Page Header vs. Report Header
- Section Groupings/Headings
- Nested Grouping and Headings
- Conditional Headings
- Sorting in Data Model vs. Sorting in Layout (RTF)
- Grouping in Data Model vs. Grouping in Layout (RTF)
For the purposes of this document, we will be covering the BI Publisher RTF tool, which utilizes Word to create the layouts.
HEADERS AND FOOTERS IN REPORTS
On most standard reports, there is a requirement to format a header and footer that print on every page. Commonly, this contains top level details about the report (report title, project number or title, etc.)
This uses the Word header and footer feature to format.

- In your RTF layout open up the header section in Word.
- Depending upon the layout/organization of this information, you may want to use a Word Table to arrange, or you can simply insert using the Word tab settings.
PAGE HEADER VS. REPORT HEADER
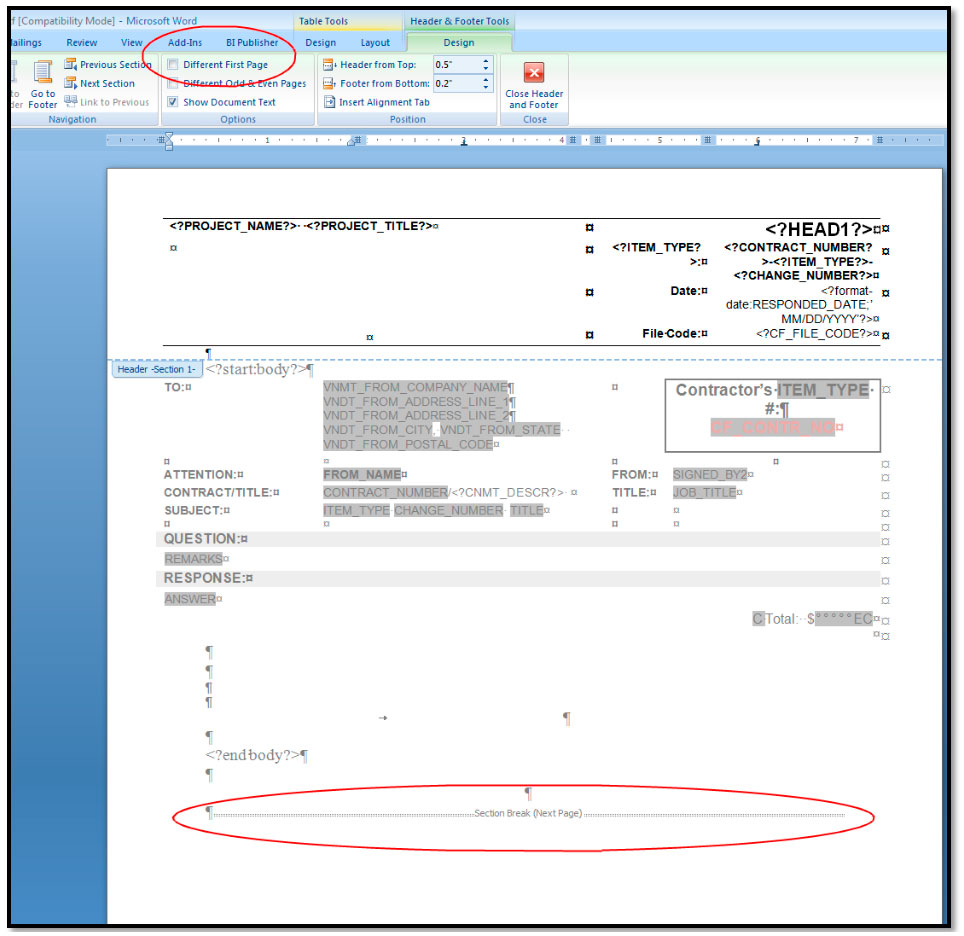
In RTF Layouts, the headers and footers use the header/footer tools in Word. For a “Report Header” (i.e. only on the first page) you would use the “Different First Page” checkbox, and create one header design for the first page, then insert a section break and add the second header on the next page.
Alternately, you can format the Word “header” section for the repeating Page content, and insert the “Report Header” content at the beginning of the report body “<?start:body?>” section BEFORE inserting any repeating content.
Section Groupings and Headings
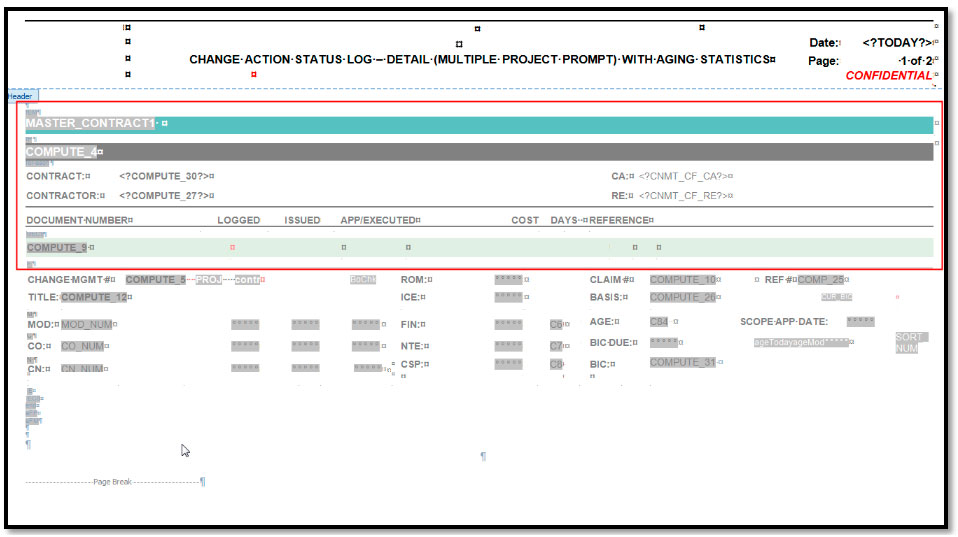
For groupings and headings of SECTIONS, these would NOT go in the Word “Header” section. Insert these in the main body of the report and use the BI toolbar and Table Properties to format.
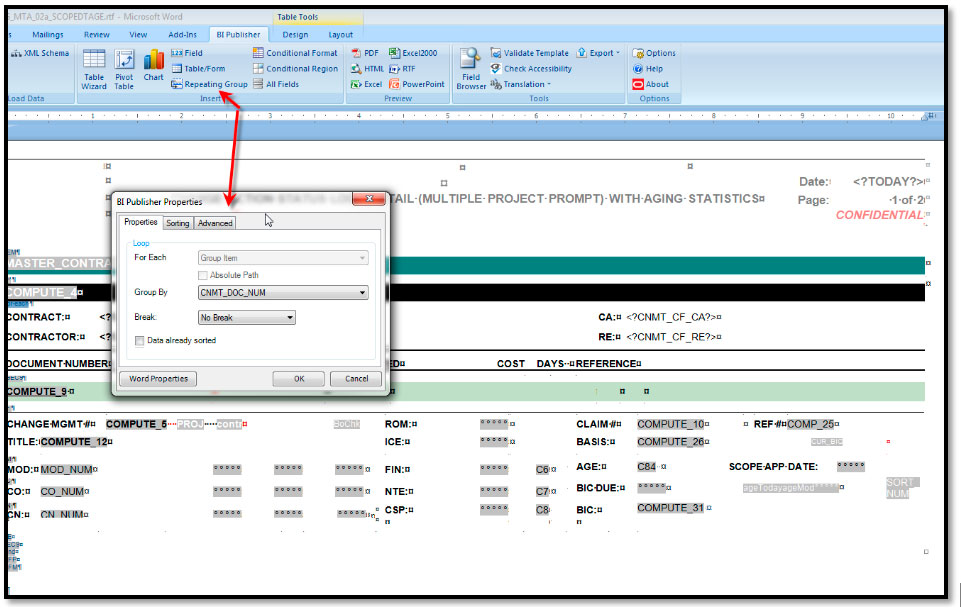
- Create the repeating group in the BI toolbar, Insert section.
- Identify what you are grouping by and whether there is a page break on this grouping.
- If the data model already sorts this data correctly, you can check “Data already sorted” or use the “Sorting” tab to manually sort after data retrieval.
- Next, select the Table properties after highlighting the rows you want to REPEAT. Check the Rows, “Repeat as header row at top of each page”.
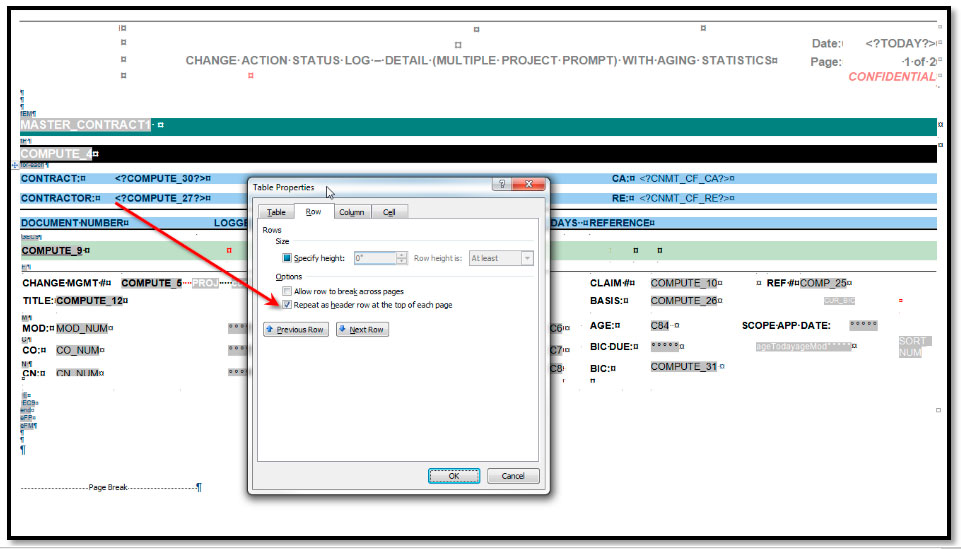
RESULTS: This will print the Word HEADER content at the top of each page, followed by the “repeat as header rows” on each repeating page until the end of that repeating section.
Nested Groupings and Headings
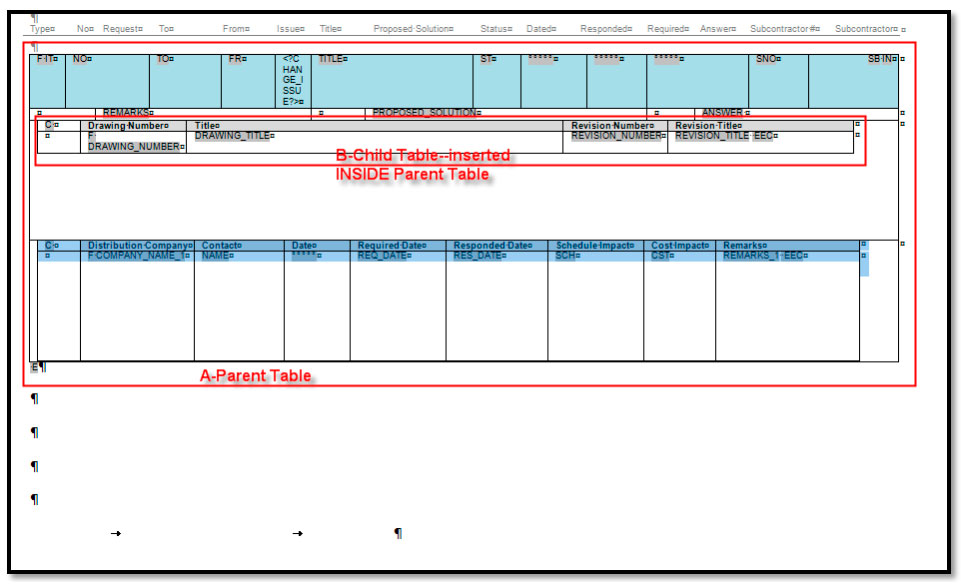
In some cases, you have one grouping section, followed by one or more “sub-sections”. After creating the primary (“Parent”) table, insert a NEW table in the row below your data and format this table with the sub-section (“Child”) data. This will be likely a repeating group WITHIN the original repeating group, and may contain conditional headings (next section).
Conditional Headings
In some cases you want column headings or labels to ONLY print if there is content for this section. In this case, you will create your Repeating Group as in the previous example, but you will ALSO create a “Conditional Region”.
In this example, we want the headings for “Drawing Number, Title, Revision Number, Revision Title” ONLY to appear IF there are drawings listed in the repeating group.
- Create the Repeating Group for the rows where the actual data appears.
- Highlight the row for the repeating group, and select Repeating Group.
- Follow steps in prior sections.
- Highlight the column heading row ONLY and select Table Properties and check to “repeat”.
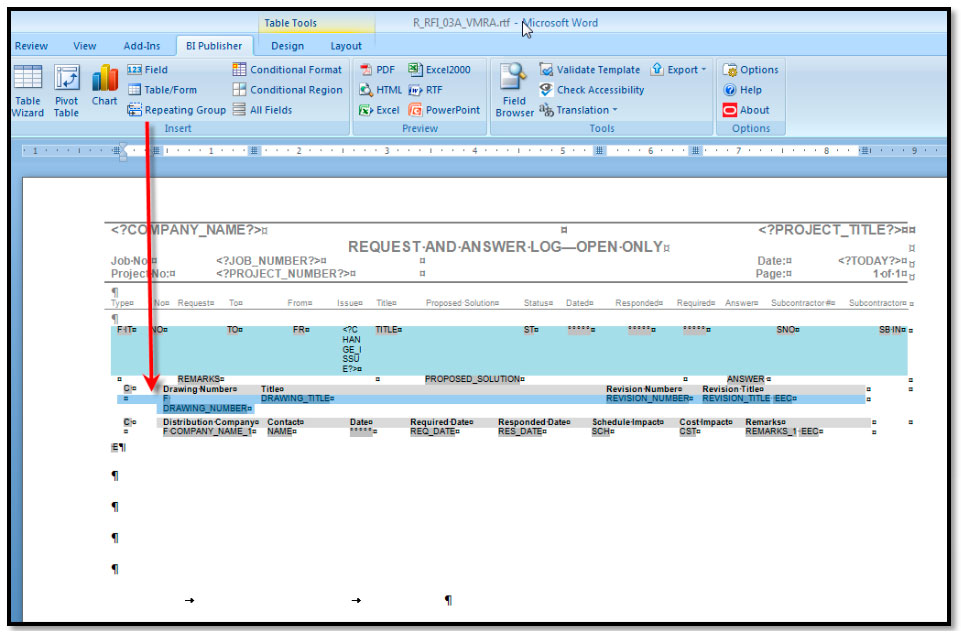
- Next, highlight the header AND repeating group rows (headings AND details for that section).
- Select “Conditional Region” and enter the criteria for showing/not showing this section.
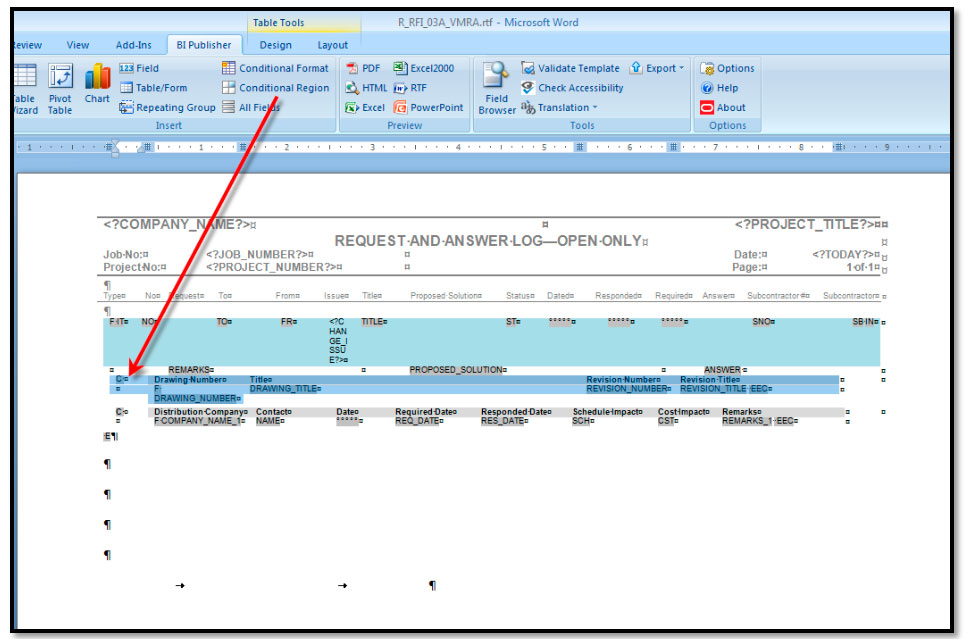
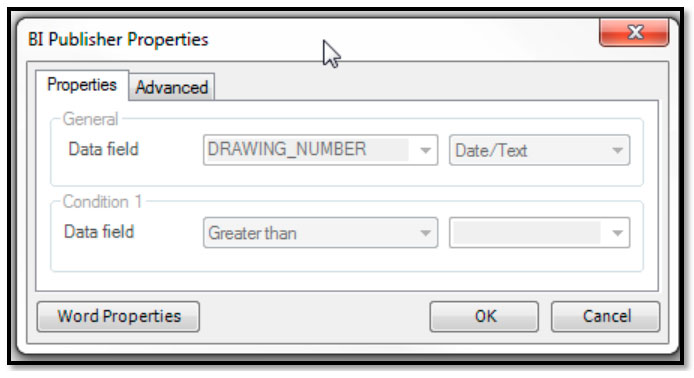
RESULTS: This will print this entire section (with its “heading”) ONLY if the condition occurs (i.e. drawings exist). Since the column headings are set to repeat, they will repeat on the next page if this section goes to two pages. If there are NO drawings, this entire section will NOT display.
SORTING IN DATA MODEL VS. SORTING IN LAYOUT (RTF)
In the prior sections, where there are sub-groupings in your report, you can use the “Sort” tab on the repeating group element to sort your data.
Otherwise, the other option is to build out the correct data order in the SQL selection in the data model. Simply use the ORDER BY in your SQL statement and select the correct order of all the components.
Note in some cases where you have multiple groupings/layouts, this may not always work; in which case you would need to use the repeating group sorting.
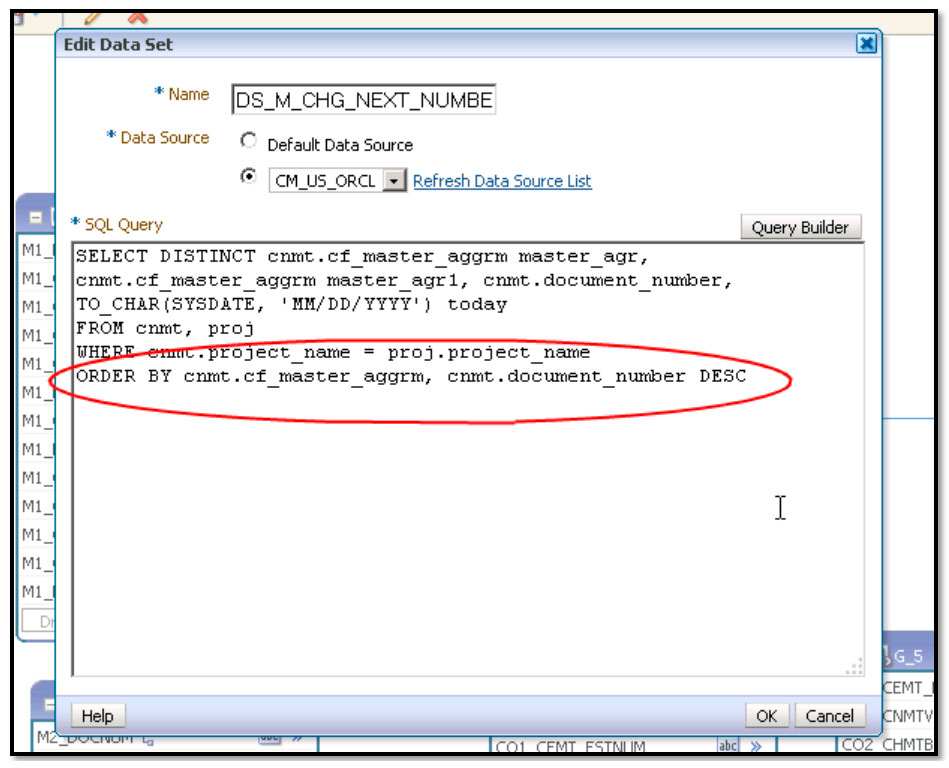
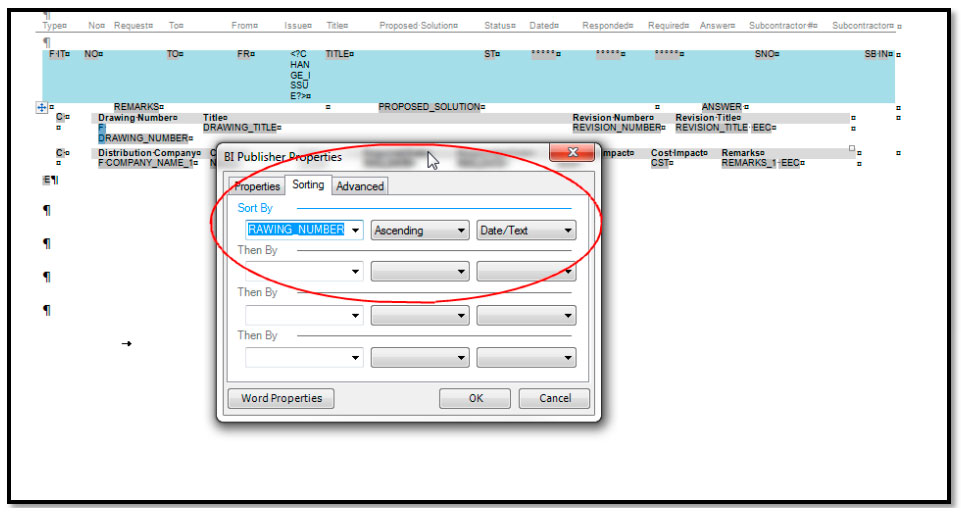
Grouping in Data Model vs. Grouping in Layout (RTF)
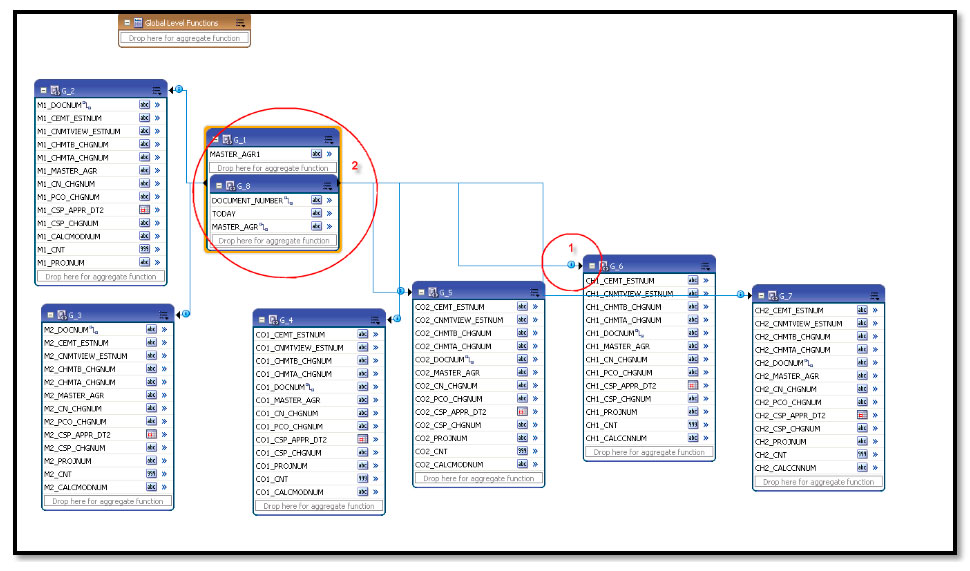
In some cases, you may need to build the grouping in the data model using multiple data sets or global parameters.
If the standard grouping methods described above do not provide the correct output, it’s possible that you may need to use one of these methods. In brief, there are two basic methods here:
- Create two data sets and use the link/join to establish the connection between the parent/child. This data will then be retrieved using that hierarchy to be used on the report.
- Use Dataset grouping to collect data retrieved in the correct order.
This is beyond the scope of this tech tip, but for very advanced reports where the standard grouping does not work, this is often a solution.
