
ORACLE PRIMAVERA CLOUD
Oracle Primavera Cloud (OPC) is a Project and Portfolio Management platform that enables organizations to plan, track, manage, and report on projects, programs, and portfolios. It integrates Project Costs, Schedules, and Risks in one environment providing a single destination for managing and reporting on projects.
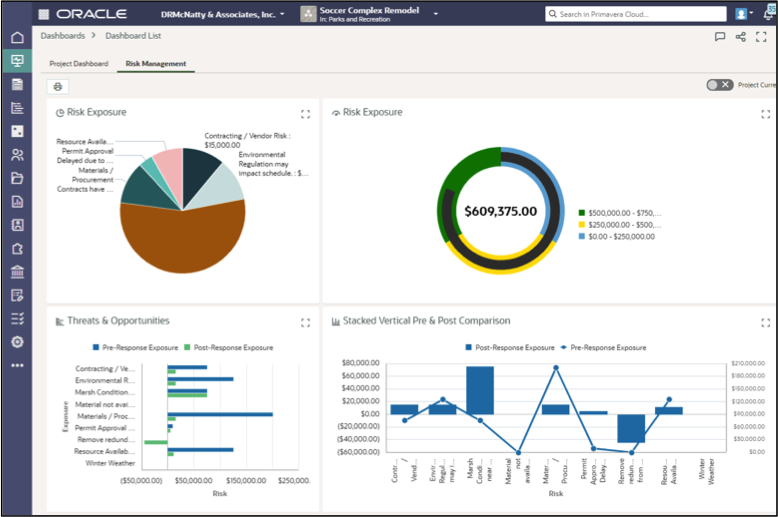
OPC provides a Risk Management solution that uses the Monte Carlo Method to incorporate activity duration uncertainty, qualitative risk assessment, and quantitative risk analysis to predict cost, duration, and date variances. Using OPC, the user can identify and prioritize potential threats and opportunities, including weather, that exist for the project or program and associate them directly to activities.
The Monte Carlo simulation provides quantitative analysis by examining the project schedule, risks, and uncertainties to calculate the chance that the project will be completed on time and within budget. The results of this information can be analyzed in the Risk module and displayed on dashboards.
This Tech Tip will demonstrate how to:
- Capture the activity duration uncertainty within the project schedule
- Record risks, probability, and impact in the Risk Register
- Run the Monte Carlo Simulation
- Analyze the results
Activity Uncertainty
Activity Uncertainty addresses the likelihood of the durations assigned to activities being correct. OPC enables the scheduler to use the Apply Activity Uncertainty option to automate a percentage-based variance or to manually enter the uncertainty.
The values entered are used during the risk analysis process to simulate different durations for each activity and calculate the potential start and end dates for the activities and overall project.
Values can be entered manually for each activity or populated automatically.
To automate the uncertainty:
- On the Schedule / Activities window, click Action and then Apply Activity Uncertainty (A).
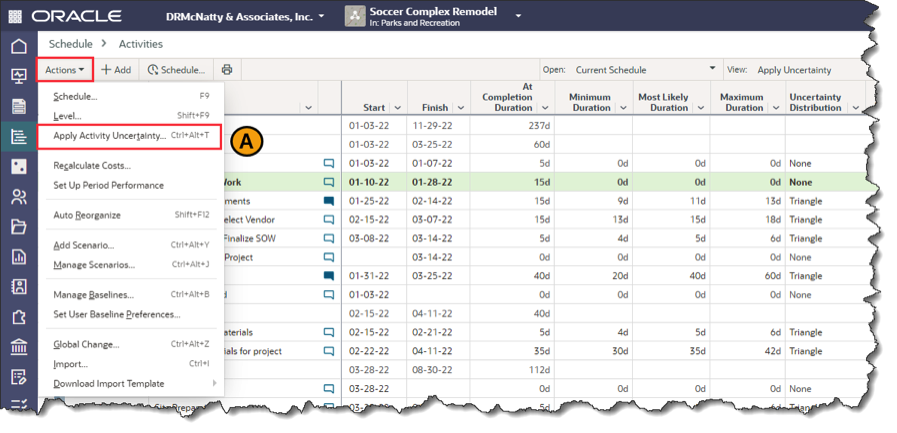
The view in the image above shows the columns At Completion Duration, Minimum Duration, Most Likely Duration, and Uncertainty Distribution.
- The Apply Activity Uncertainty window opens the settings window used to populate the uncertainty values.
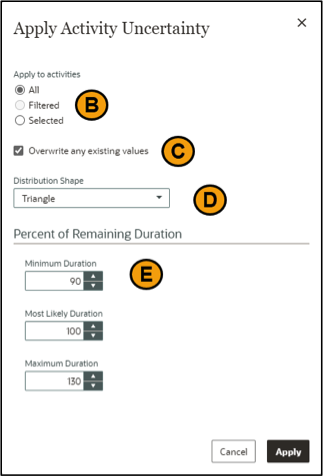
- Apply to Activities (B) determines if the change is global or for specific activities. The Selected option applies the change to the group of activities highlighted in the schedule. The Filtered option is available if a filter has been applied to the schedule.
- Overwrite any Existing Values (C), if selected, applies the new values over top of the displayed uncertainty. If not selected, only those activities without values will be overwritten.
- Distribution Shape (D) identifies the shape of the uncertainty distribution. The Uniform option provides 2 data points, minimum and maximum, in the Percent of Remaining Duration. The triangle option uses 3 data points: minimum, most likely, and maximum. The None option is used to disable the estimates.
- Percent of Remaining Duration (E) sets the values used to calculate the uncertainty for the activities.
- Click Apply to update the activities with the new uncertainty estimates.
Risk Register
The risk register serves as a central repository for risk data. Its key function is to provide a clear view of the current status of each of the recorded risks. The Risk Register is available for both Projects and Programs.
The Project risk registry identifies risks specific to a project. The Program risk register displays both the program level risks and the project level risks for the projects included in the program. Program managers can then identify and manage risks across the program.
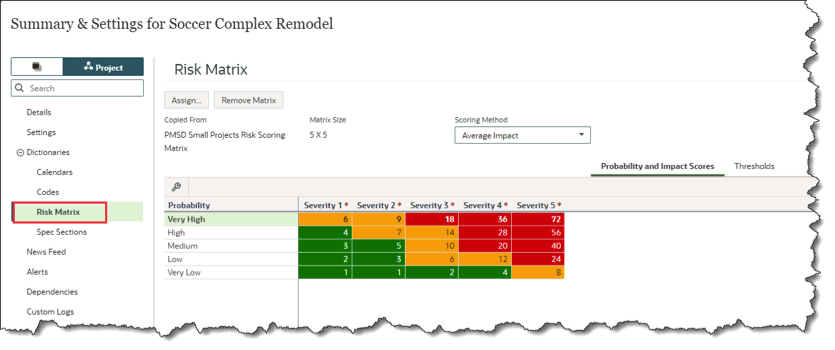
A scoring matrix is used to compute the risk score. One is assigned to each project and program to define the probability levels and impact thresholds to use when evaluating the severity of a risk. Risk scores quantify the impact of each risk in terms of its total effect on the cost and schedule of the project or program.
In addition to the identification information (name, cause, description, etc.), the Risk Register window captures the Probability of the risk occurring, Schedule Impact, and Cost Impact. These values are used in the Monte Carlo simulation to calculate potential finish dates and cost estimates.
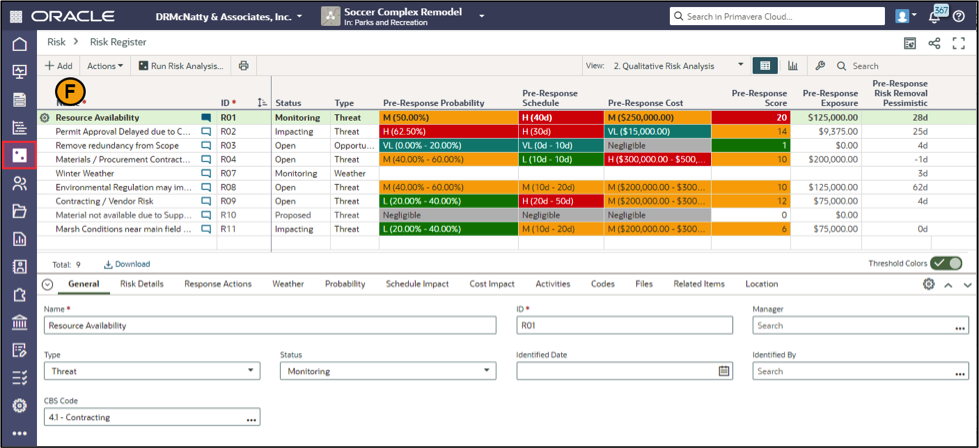
To capture Risk information:
- On the Risk Register window, click Add (F) to create a new Risk.
- On the General tab in the lower window, enter the name, id, type, status, and other identifying information.
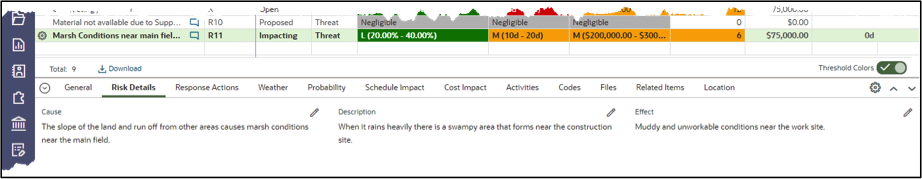
- Use the Risk Details tab to enter the cause, description, and impact.
- Display the Pre-Response Probability, Schedule Impact, and Cost Impact fields and use the dropdown values to select the range that best represents the level of the Risk.
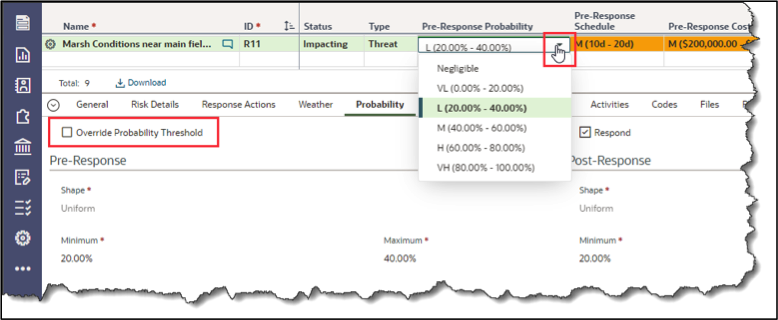
These values can be overridden to be more precise in the corresponding lower window tab if the “Override Threshold” option is selected.
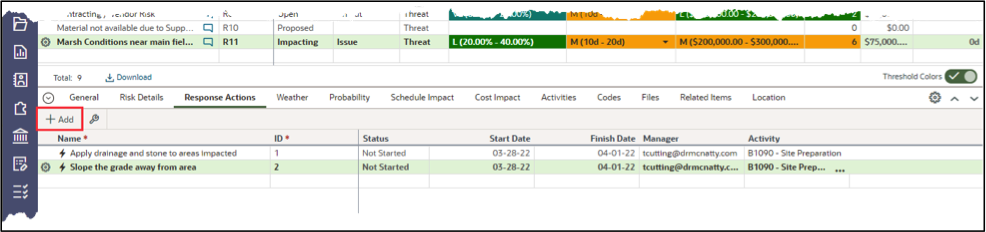
- Create actions steps in the Response Actions tab. These define what needs to be done to address the Risk. These actions can be tied to specific Activities for tracking. Click Add to create a new action. These actions can be tied to a specific activity in the project schedule.
- Display the Post-Response Probability, Schedule, and Cost Impact fields to enter the estimated values if the Response Actions proposed are completed. Manually enter the values on the Post-Response side of the corresponding

- On the Activities tab, tag the activities from the schedule that this Risk impacts. When the Risk Analysis is run it factors the Probability and Schedule Impact settings into the dates for those activities. If no activities are listed, the Risk Analysis factors those settings against the project start and finish dates.
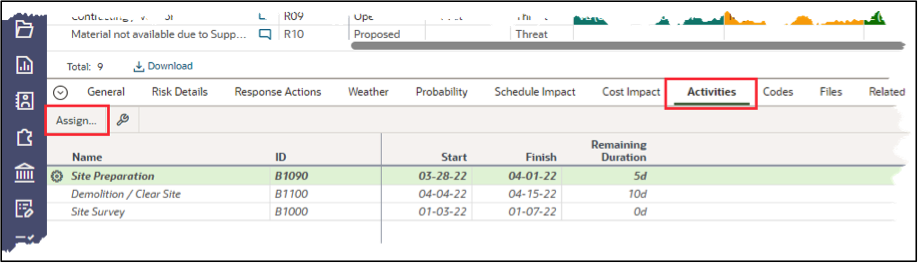
- Use the other tabs to enter Risk codes, attach files, link to Program level risks (Related Items), and specify a location for the Risk.
To capture Weather related Risk information:
- Select “Weather” (G) in the Type column.
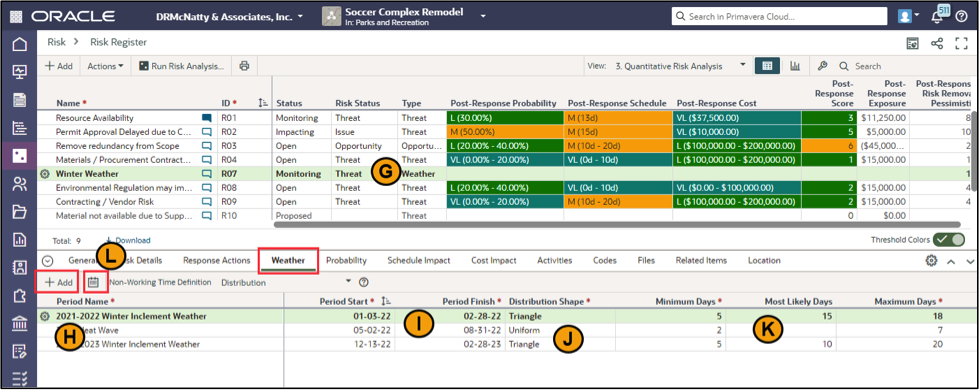
- In the Weather tab in the Risk Details window, add a line item.
- Enter the Period Name (H).
- Pick the Start / Finish dates (I).
- Select the Distribution Shape (J) and fill in the number of potential days impacted by inclement weather. Triangular distribution enables 3 touch points (Min, Max, and Most Likely) and Uniform provides just Min and Max.
- Click on the calendar image (L) to calculate and display the Weather Probability Calendar showing the distribution of potential days impacted.
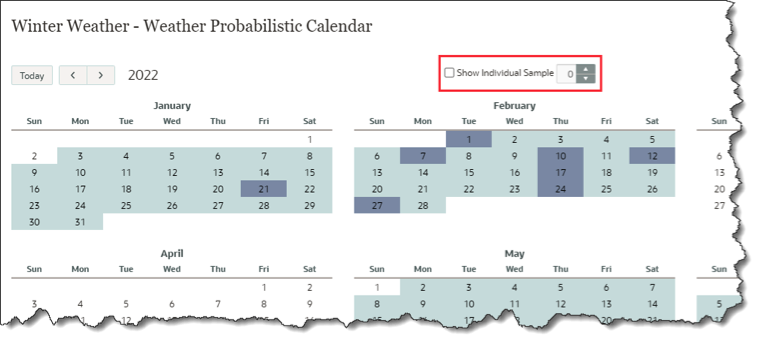
- To see a specific iteration of the impact, select the Show Individual Sample and pick a number (1-100).
With the Risks identified in the registry, the next step is to run the Risk Analysis and review the results.
Risk Analysis Execution
The Risk Analysis window displays the results of the Monte Carlo Simulation. It is only available at the project level.
When a risk analysis is performed, it runs up to 5000 iterations ito calculate the risk impact on project cost, activity durations, and start and finish dates. Based on settings at run time, OPC uses the following factors to calculate the variances:
- Costs: Probability, project level costs, and cost impact
- Duration: Probability and activity uncertainty
- Start and Finish Dates: Probability, activity uncertainty, and schedule impact. If a Risk has activities associated with it, the simulation uses the activity dates. If not, the project level start and finish dates are used.
To run a Risk Analysis:
- On the Risk Analysis window, click Run Risk Analysis.
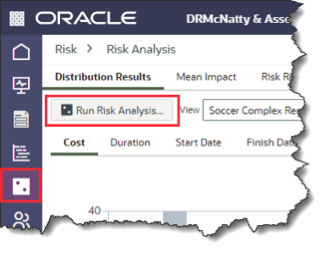
- The analysis slide option allows the user to quickly pick settings based on how quickly they want the simulation to run.
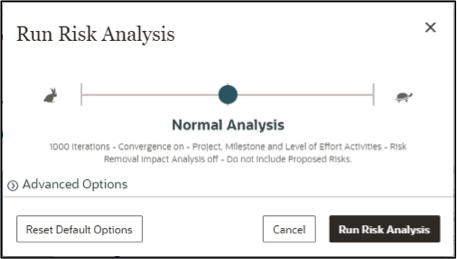
- Use the Advanced Options to select the settings used to run the simulation. The options selected impact the amount of processing and the speed with which it will complete.
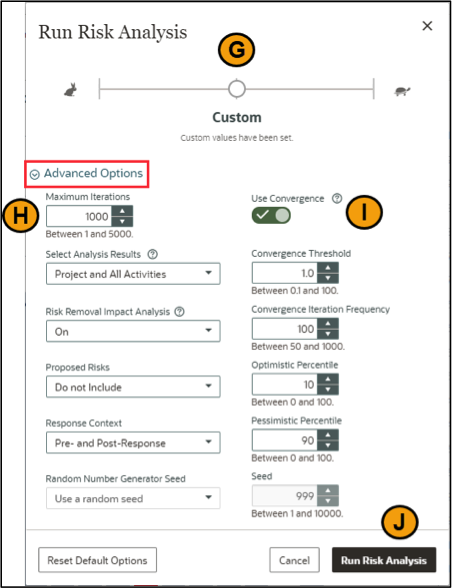
Left-hand Options (G):
- Maximum Iterations: defines how many variations are run.
- Select Analysis Results: determines the level of data to process (Project; Project, Milestones, and Level of Effort Activities; Project and All Activities).
- Risk Removal Impact Analysis: Simulates the complete removal of each risk and ranks the effect it has on the Pessimistic Finish and Remaining Cost. It also analyzes the removal of all activity uncertainty values and their impact on the Pessimistic Finish.
- Proposed Risks: Includes or excludes risks in “proposed” status.
- Response Context: Determines whether Pre-Response, Post-Response, or both are analyzed during the run.
- Random Number Generator Seed: Random numbers are used to sample distributions on activity duration, risk probability, and risk schedule. This option allows a seed number for the random generator to start with.
Right-hand Options (I):
- Use Convergence: selects whether or not to stop the iterations based on the difference in the results aligning based on a threshold. This allows the process to end sooner if continuing will not produce different results.
- Convergence Threshold: sets the target percentage change to check for between groups of iterations.
- Convergence Iteration Frequency: defines the number of iterations in a group to run before checking the threshold.
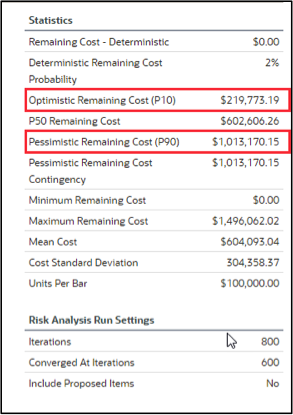
- Optimistic and Pessimistic Percentiles: selects the P-values to display in the Statistics window of the analysis.
- Once the settings, either using the slide or manual settings, are selected, click Run Risk Analysis (J).
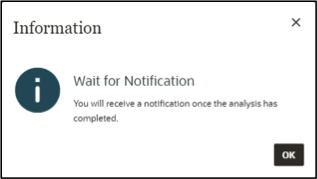
This will kick off the Monte Carlo Simulation and may pop up a “Wait for Notification” window indicating that the process is running in the background.
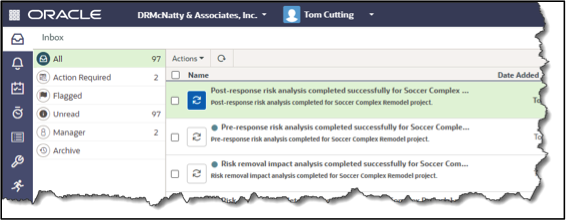
As each of the analysis executions finishes a notification will be posted to the inbox.
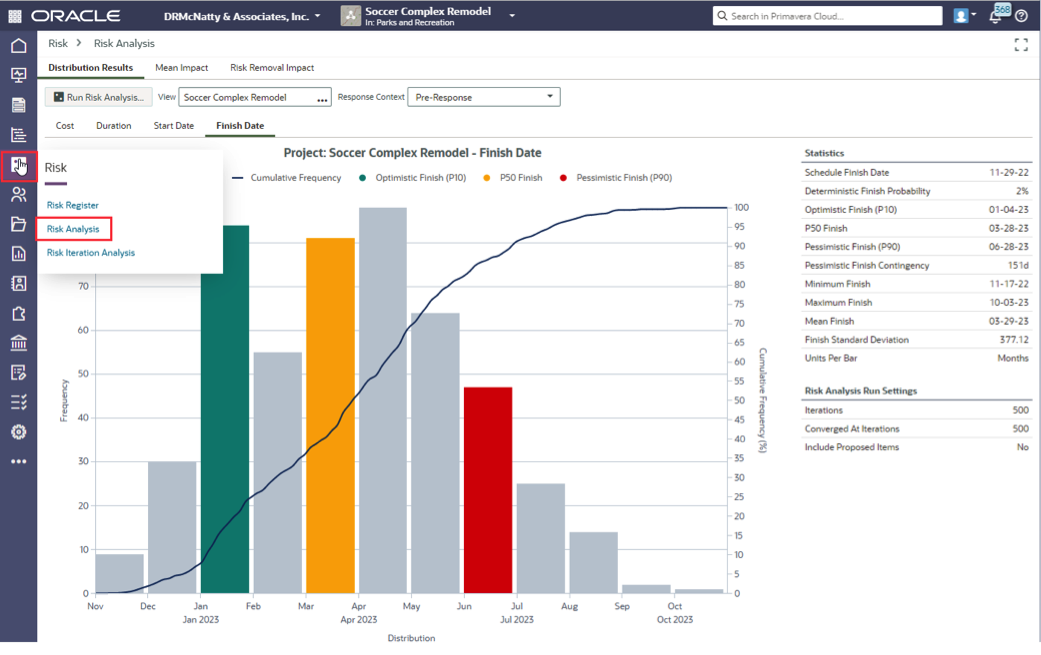
Risk Analysis Results
The Risk Analysis window presents the simulation results in 3 different areas: Distribution Results, Mean Impact, and Risk Removal Impact.
Distribution Results:
The distribution results window displays the analysis of Cost, Duration, Start Date, or Finish Date distribution. The View (K) allows the display to show the full project or a specific activity. The Response Context (L) alters the display to show data from the Pre-Response, Post-Response, or both. The options available in the Response Context depend on what was selected in the analysis settings at run time. For example, if only Pre-Response was selected in the settings, then Post-Response data will not be available.
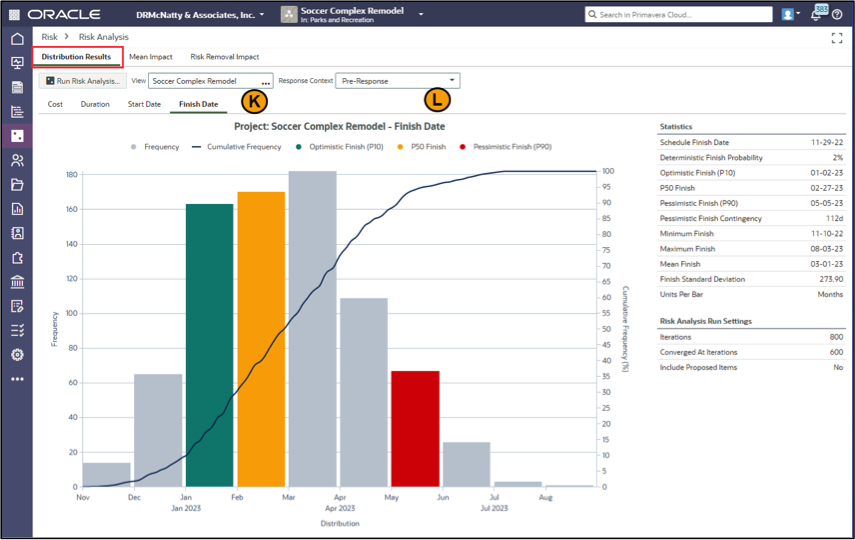
The display shows the distribution (cost, duration days, or dates) as a bar chart with the frequency of the value occurring in an iteration of the simulation.
Mean Impact:
The Mean Impact analysis ranks each risk according to its potential impact on the project by either cost or duration. Hovering over a specific risk (M) describes its impact. If the Show Contribution Breakdown option is selected, the bars show how much each risk impacts the durations.
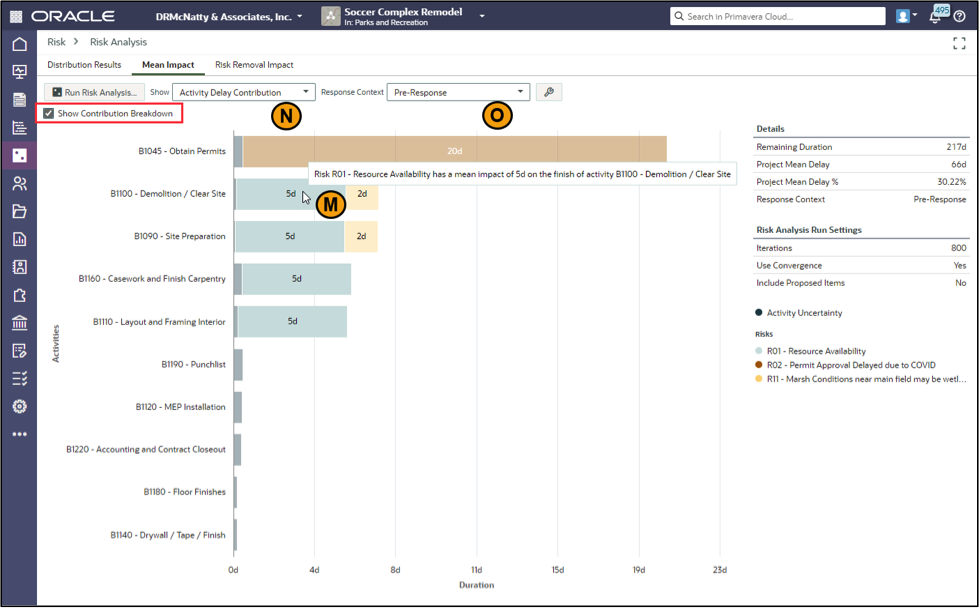
This analysis shows which risks and activities may have the greatest average impact on the project based on the Show (N) selection:
- Activity Delay Contribution
- Activity Cost Contribution
- Risk Delay Contribution
- Risk Cost Contribution
Results can be shown for Pre- or Post-Response values in the Response Context (O).
Risk Removal Impact:
Risk Removal Impact measures each risk’s impact on the project’s remaining duration or cost. To do this the algorithm removes the risk and related activity uncertainty from the calculation and then checks the Pessimistic Finish and Remaining Cost against the previous values. The result is the impact percent.
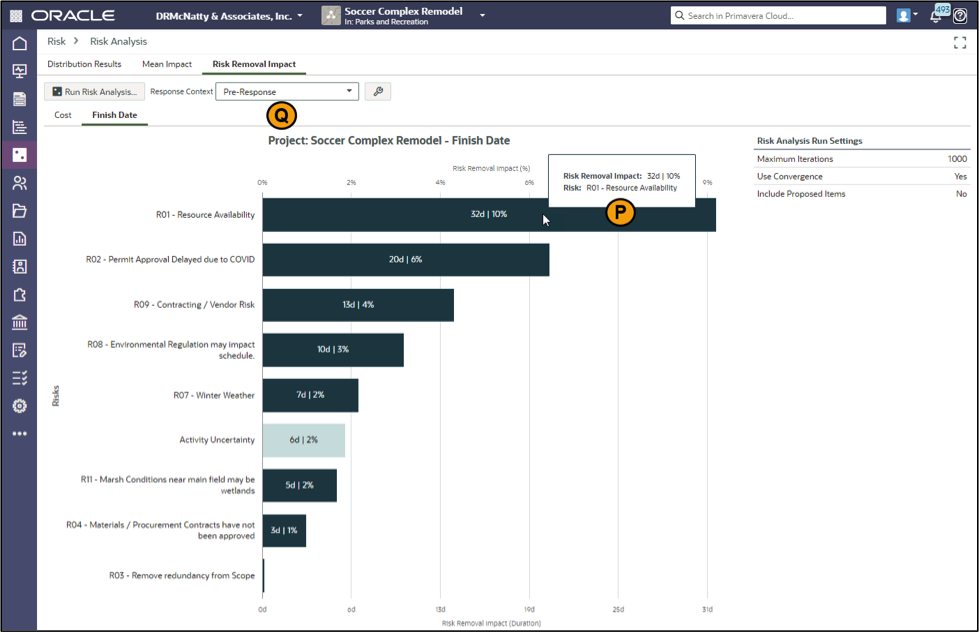
Hovering over a risk will display the impact (P).
The context (Q) can be displayed for Pre- or Post-Response values.
Risk Iteration Analysis
The Risk Iteration Analysis displays the first fifty iterations of the risk analysis results. Viewing each iteration allows the uncertainty and risks entered to show how an activity might directly impact the project dates, critical path, and critical activities. The iterations also demonstrate how the Monte Carlo analysis determined the risk analysis results.
Iteration analysis compares the activity values entered on the schedule (deterministic values) with the random scenarios generated in each iteration. The table and Gantt chart information allow the analysis of the impact the durations and risks have on the project schedule for a given iteration. The impact that weather non-working days (R) may have on your project dates can also be displayed. Iterations are assigned a number (S) so that you can revisit iterations that you’d like to view again.
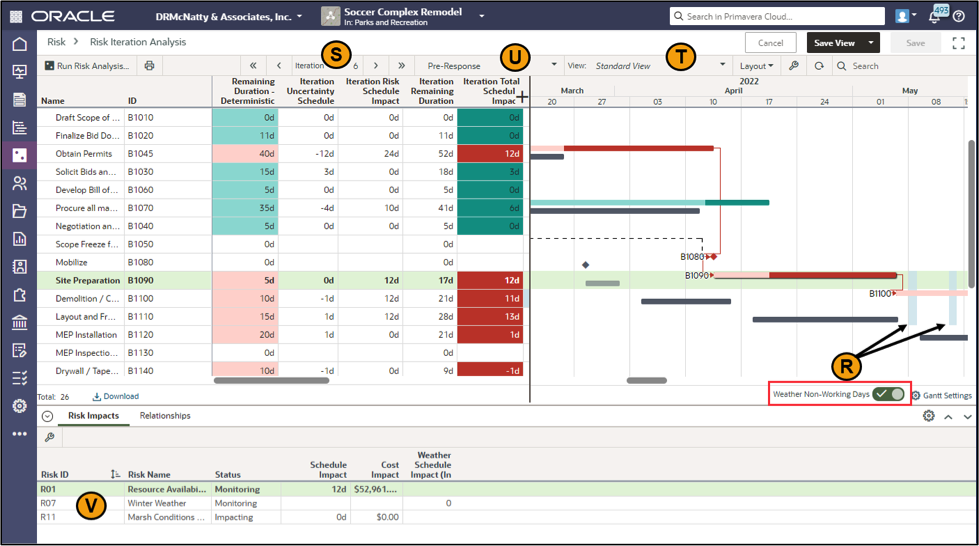
Views (T) can be used to save and display information like the standard Activity window and both Pre- and Post-Response (U) data can be shown.
The Risk Impact tab (V) in the details window shows which risks are affecting the schedule.