Integrated Reporting Dashboard
DRMcNatty integrated Primavera P6, SAP and a homegrown database into a
comprehensive dashboard enabling better project management and decision making using real-time status and financials.
DRMcNatty integrated Primavera P6, SAP and a homegrown database into a
comprehensive dashboard enabling better project management and decision making using real-time status and financials.
A major California gas and electric utility (The Utility) used a variety of software applications to store and report on project controls information. Primavera P6 for schedule and project milestone tracking, SAP for financials and actual cost data, and a “homegrown” database with cost and schedule data created a challenge to get much-needed data from all of these systems in a single, unified format.
Two challenges existed for presenting key data to the organization’s decision makers. (1) The method of collecting, validating and presenting information needed to be as timely as possible. (2) The solution had to satisfy the reporting needs of diverse users involved with Project Portfolio Management (PPM). For example, project managers and project control supervisors are responsible for reviewing specific deliverables when looking at reports. The solution needed to be very accessible and flexible to meet the data needs of all the project participants.
DRMcNatty & Associates, Inc. (DRMcNatty), worked closely with The Utility’s staff to identify the reporting requirements of various stakeholder groups, both at execution and at management level. The solution was an Integrated Reporting Dashboard. Data collection was achieved by working side-by-side with the client and stakeholder groups to identify the information required to achieve the client’s goals. Once established, DRMcNatty’s development team set up automated
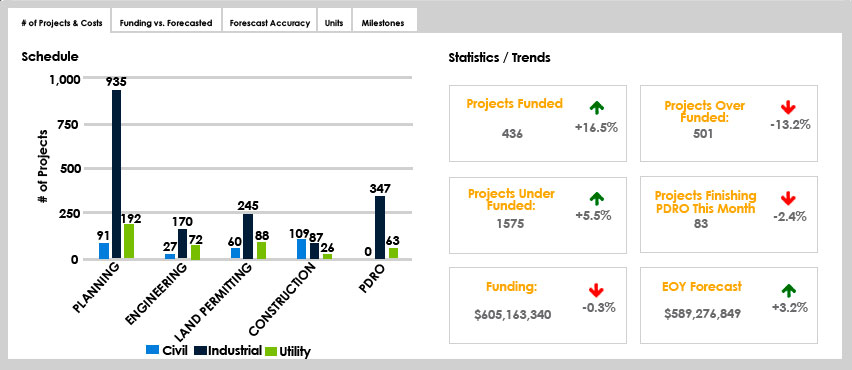
routines using a combination of flat files and web services to consolidate the information into a single data warehouse. Once the project controls data was accessible, the DRMcNatty team worked with The Utility on a web based, security-enabled project dashboard solution hosted by MLM Project Services, DRMcNatty’s wholly-owned hosting affiliate. This allowed project stakeholders (at all levels) to view data at the portfolio level as well as down to individual project data. Portfolio level data is available using P6 project codes for dynamic filtering of select projects and supported by customizable graphics which graphically display information. The Integrated Reporting Dashboard also allows users to examine various levels of information via “drill down” capabilities to view detailed project information such as milestone dates, summary schedule gantt charts, and P6 noteboook topics, all within a single interface.
DRMcNatty’s solution is a robust and flexible reporting tool that provides timely information for stakeholders ranging from “C” level executives to project managers. The web-based solution provides access anywhere an internet connection is present, including smart phones and tablet devices. The Utility now has the ability to make faster decisions, using critical information to save time and money.
