ORACLE PRIMAVERA P6
DOWNLOAD THE PDF HERE
At times, the best way to communicate the impact or a change in a schedule is through graphical representation of the activities and the Gantt chart. This can easily be achieved by customizing the “Print Preview” option in P6. This month, we will explain how to customize the “Print Preview” option in P6 to create custom data output.
In this example, we want the “Print Preview” to illustrate only activities that fall under the WBS element of “Brick”. We also want to view these activities represented in the Gantt chart with all associated logic ties.
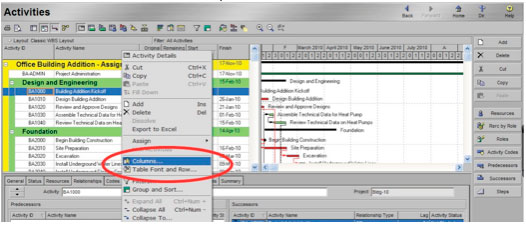
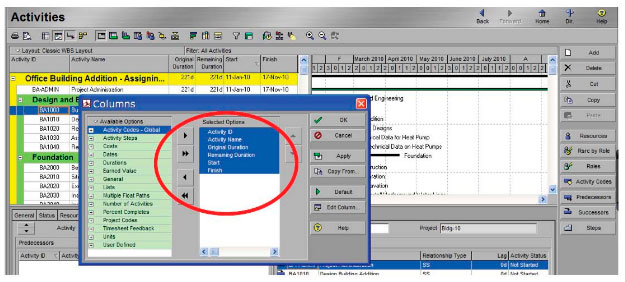
The first step to achieving this data output is to select or customize a layout with only the activity columns you wish to display on the “Print Preview” screen. In this example, we have selected the Classic WBS layout and changed the displayed columns to “Activity ID”, “Activity Name”, “Original Duration”, “Remaining Duration”, “Start” and “Finish”. We do this by “right clicking” anywhere within the field illustrated below.

Next, select columns from the drop down box.
Finally, we add or remove columns from the “Selected Options” window until the only the columns you wish to see in following layout.
Next, we turn on the relationship lines in the “Gantt Chart” by clicking the “Relationship Lines” shortcut illustrated below.

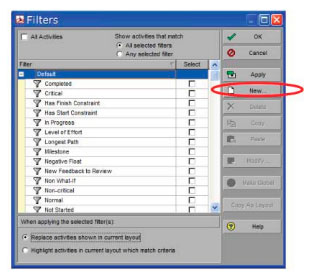
Next, create a filter that will display only the activities that fall under the “Brick” Work Breakdown Structure. To create a custom filter, left click on the filter shortcut, illustrated below. This will open the “Filters” dialog box.

In the “Filters” dialog box, select “new”.
In the filter criteria window, we set the criteria as follows:
– The “Parameter” field is set to “All of the following” and “WBS.”
– The “IS” field is set to “equals” and
– The “Value” field is set to the WBS element where the activities reside. In this example, we select “Brick”. We select this WBS element by left clicking on the element. We then assign the selected element to the filter by left clicking the green plus in the “Select WBS” window.
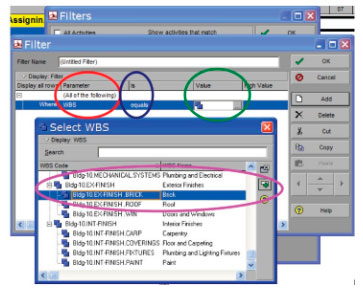
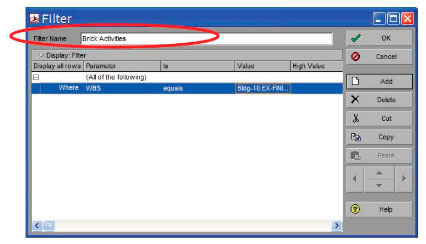
Finally, name the filter by left clicking in the “Filter Name” dialog box and enter my . filters name We have selected “Brick Activities” as the name of the filter, illustrated below. Once we are satisfied with all of the criteria of my filter, we click OK to close the “Filter” dialog box.
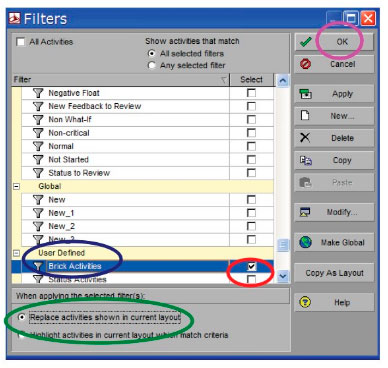
To “apply” the “Brick Activities” filter, first we want to verify that no other filters are being applied to this project. Next, in the “Filters” window, scroll down to the “User Defined” filters”. To “select” the Brick Activities” filter, left click in the white box to the right of the filter, this box is found in the “Select” column, as illustrated below. Before applying this filter, we want to verify that “Replace activities shown in current layout” is selected. Finally, left click “OK” to apply the filter.
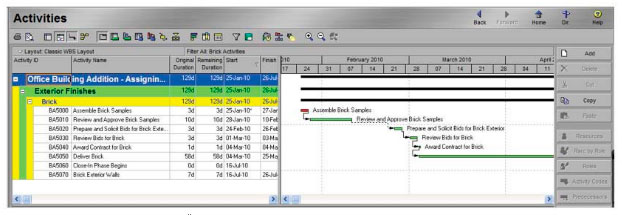
After applying the User Defined filter, the layout shows only the “Brick” activities, as illustrated below.
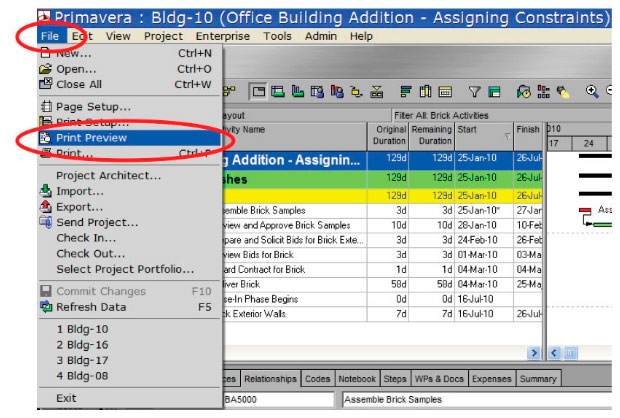
Next, we want to move to the “Print Preview” screen and make the remaining changes to my custom output. To do so, select “File”, from the activities screen and select “Print Preview” from the drop down box, as illustrated below.
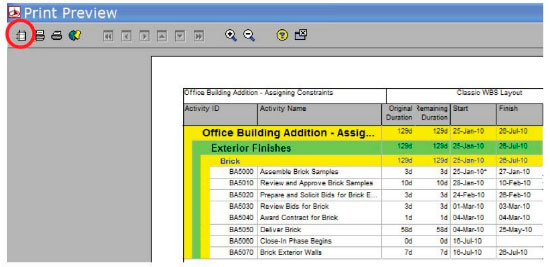
From the Print Preview screen, select the “Page Setup” icon in the upper left corner of the screen, as illustrated below. This will open the “Page Setup” window.
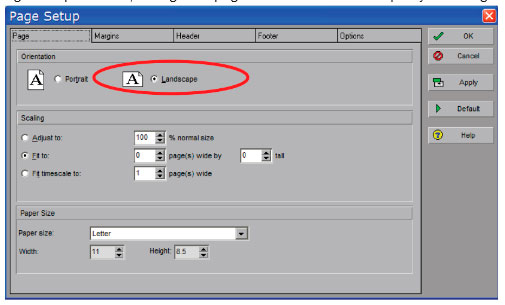
In the “Page Setup” window, change the page orientation to landscape by selecting “Landscape”.
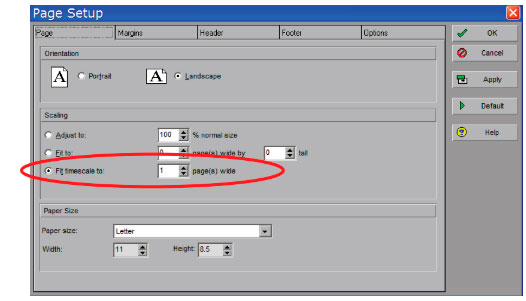
Next, select “Fit Timescale” to 1 page(s) wide; to be sure all of the data is formatted to f t on (1) page.
Next, select the “Options” tab in the “Print Preview” window. In this tab, we will make changes to the “Timescale
Dates”. These dates represent what data or “Activities” will be displayed in the Gantt chart.
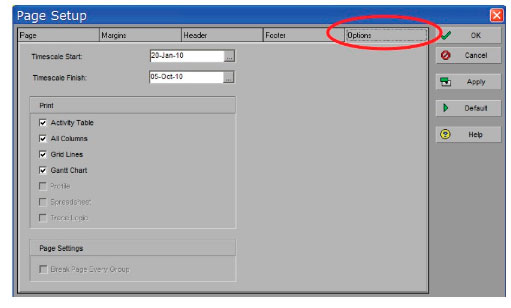
In the “Timescale Start” field, click the ellipsis and select “Custom Date” from the drop down box. The custom date we select will be the earliest start date of all “Brick” activities. This will ensure that the graphical display in the Gantt chart starts displaying data only on the dates we are interested in viewing.
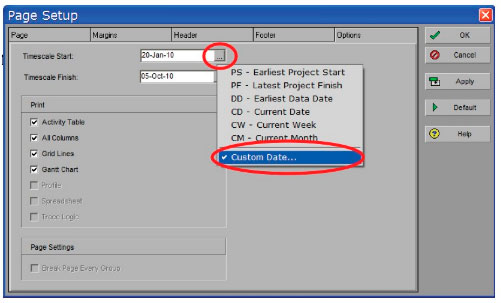
Finally, the “Timescale Finish” date we select will typically be 2-3 months after the last activity is scheduled to finish. We select this date to be sure that all of the activity naming convention is completely displayed in the Gan tt Chart.
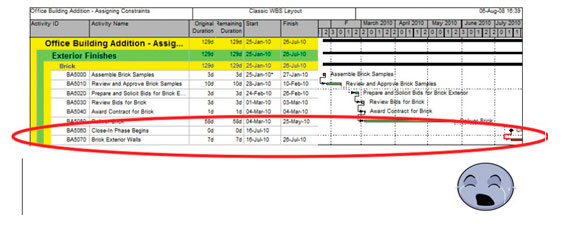
Illustrated below, we selected 26 July 2010 as the “Timescale Finish” date. Note how the activity names for activities BA5060 and BA5070 are cut off from being completely displayed in the Gantt chart.
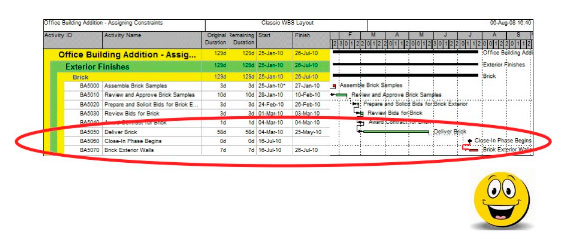
To solve this problem, we select a “Timescale Finish” date of 4 October 2010 to capture all of the text associated with activity BA5060 and BA5070. See the example below.
Finally, the finished product is printable to a local printer for presentation or to .pdf for E-mail. Without using the custom report tool in P6, we have created custom output specific to my selected activities and illustrated their impact on the schedule by way of graphically displaying the activities in the Gantt chart.
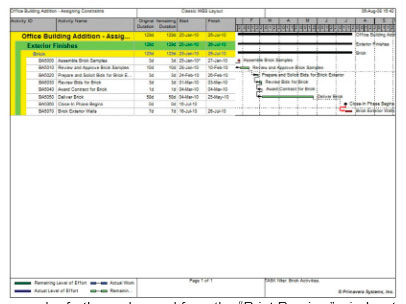
The “Print Preview” option can be further enhanced from the “Print Preview” window to include customized “Headers” and “Footers”. Additionally, output can be published to HTML.
