BI PUBLISHER
DOWNLOAD THE PDF HERE
The Rich Text Format (RTF) template is one of the most versatile methods for creating meaningful reports from BI Publisher. The RTF template allows individuals to create a report using Word as the editor. This enables Word formatting, headers and footers, and other features to be used to display information. One of those features that is generally taken for granted, but is key for formatting the RTF template, is the table. Simple rows and columns provide the basis for organizing the structure of the template and ensuring everything stays in its place.
This Tech Tip extends the use of table to include embedded tables and merged cells to display more data in less space. The Tip also shows how to create a box around an area based on a variable. The end product would be a report like the one shown below, where several columns of data are displayed and the Modification, Change Order, or Change Notice sections is highlighted by placing a conditional border around it.
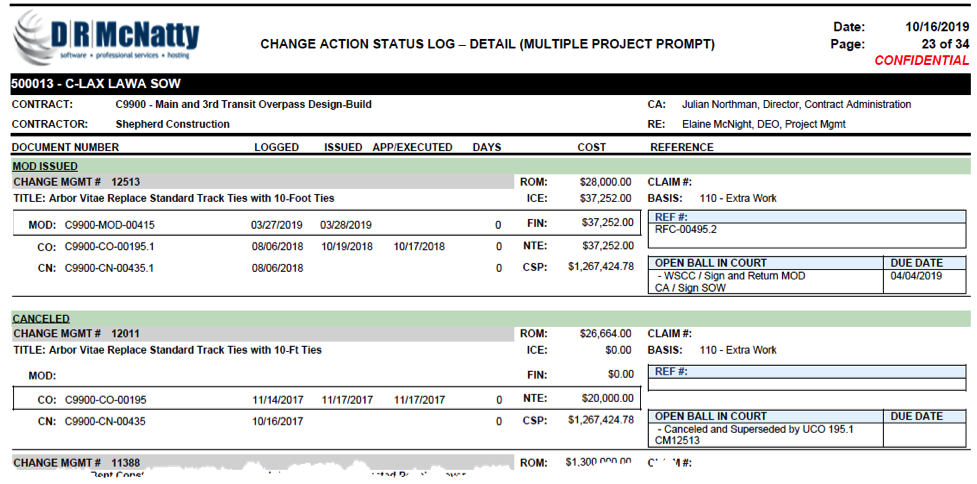
Table Structure
When exposed, the lower portion of the report is actually a mesh of embedded tables and merged cells.

This particular rendition began with a 4×4 cell table with a few modifications as described below.

The first alteration is to merge cells for (A) and (B). By spacing those sections across 2 rows each, it allows the content to expand some without altering the size of the left hand rows. This is especially true with (B) where the bottom left hand row (C) will be empty. If (B) was aligned with the row above (C), then any expansion in (B) would distort the sizing on the left.
The next step is to size the columns to match the data stored in them. This will be adjusted when the data is added, but is needed to fit the other pieces now.
On the right hand side, a 2×1 table (D) and a 2×2 table (E) are added. The first row in each is the title and the second is a Repeating Group of data, in this example, the Reference Numbers associated with the change in (D) and Ball in Court actions with due dates in (E) as shown below. The internal tables are necessary because the data may contain more than one row and the table establishes the structure and consistent spacing.
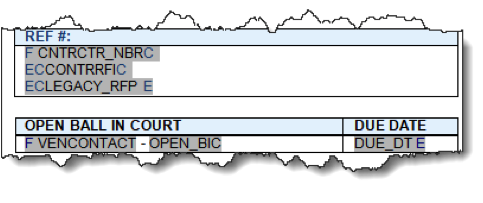
In the upper left corner, nested embedded tables have been created. The outer table (F) is used here for the MOD, CO, or CN label on each row. The inner table (G) contains another Repeating Group for if more than one modification is recorded. In the image below the F and E signify the start and end of the Repeating Group.

Once (F) and (G) are formatted correctly, those tables can be copied to the other two cells on the left and populated with the CO and CN data.
It is a good idea to adjust the alignment (center, top, etc.) while you can still see the borders. That way you can be sure the tables within the tables are formatted the way you want them.
When all the pieces are in place, remove the borders from each section to hide the structure.
Conditional Border
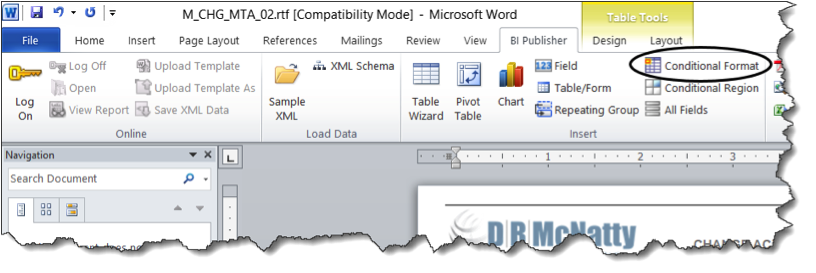
The conditional border used to put a box around a specific row is based on a field within the data model that indicates which phase the Change Management record is in (MOD, CO, or CN). Each of the cells that are to have the border will have a Conditional Format set up using the BI Publisher Add-In.
In the image below, the Ms, Cs, and Ns in each box contain conditional format code.

On the left hand the border will be on the left, top, and bottom. The center will be just top and bottom and the right will be top, bottom and right. This will encase the row in a complete box. Notice on the left the M is outside of the 2 inner tables. This should be true for the C and N in that column.
When the Conditional Format option is selected, a setup window opens to walk through the settings.
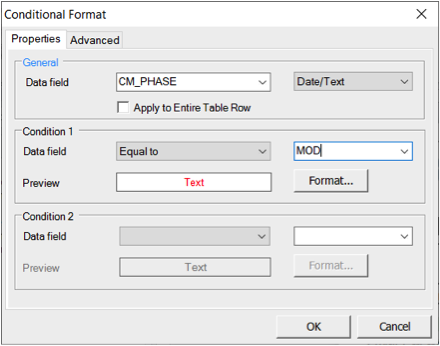
Select the data field, in this case CM_PHASE, to be checked. Change the type to Date/Text, create a condition of Equal To, and fill in the appropriate value (MOD, CO, CN). Quotes around the value are not needed. If all of the data is on a single row, the Apply to Entire Table Row check box can be used. In the example, the REF# and Ball In Court columns are not included, so each cell to be encircled needs to be set up.
Instead of using the Format… option, open the Advanced tab.
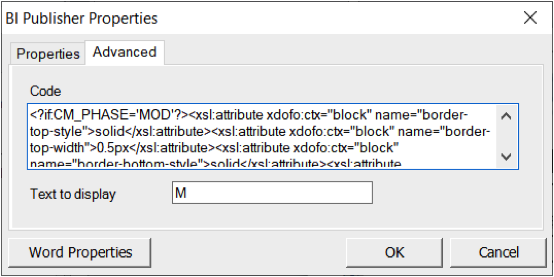
Change the Text to Display to an appropriate identifier.
In the Code area, copy and paste the following to set the border for the Left, Top, and Bottom.
<?if:CM_PHASE=’MOD’?>
<xsl:attribute xdofo:ctx=”block” name=”border-top-style”>solid</xsl:attribute>
<xsl:attribute xdofo:ctx=”block” name=”border-top-width”>0.5px</xsl:attribute>
<xsl:attribute xdofo:ctx=”block” name=”border-bottom-style”>solid</xsl:attribute>
<xsl:attribute xdofo:ctx=”block” name=”border-bottom-width”>0.5px</xsl:attribute>
<xsl:attribute xdofo:ctx=”block” name=”border-left-style”>solid</xsl:attribute>
<xsl:attribute xdofo:ctx=”block” name=”border-left-width”>0.5px</xsl:attribute>
<xsl:attribute xdofo:ctx=”block” name=”border-right-style”>none</xsl:attribute>
<?end if?>
For the center section, do the same steps, but replace the code with
<?if:CM_PHASE=’MOD’?>
<xsl:attribute xdofo:ctx=”block” name=”border-top-style”>solid</xsl:attribute>
<xsl:attribute xdofo:ctx=”block” name=”border-top-width”>0.5px</xsl:attribute>
<xsl:attribute xdofo:ctx=”block” name=”border-bottom-style”>solid</xsl:attribute>
<xsl:attribute xdofo:ctx=”block” name=”border-bottom-width”>0.5px</xsl:attribute>
<xsl:attribute xdofo:ctx=”block” name=”border-left-style”>none</xsl:attribute>
<xsl:attribute xdofo:ctx=”block” name=”border-right-style”>none</xsl:attribute>
<?end if?>
The right hand section should be changed to
<?if:CM_PHASE=’MOD’?>
<xsl:attribute xdofo:ctx=”block” name=”border-top-style”>solid</xsl:attribute>
<xsl:attribute xdofo:ctx=”block” name=”border-top-width”>0.5px</xsl:attribute>
<xsl:attribute xdofo:ctx=”block” name=”border-bottom-style”>solid</xsl:attribute>
<xsl:attribute xdofo:ctx=”block” name=”border-bottom-width”>0.5px</xsl:attribute>
<xsl:attribute xdofo:ctx=”block” name=”border-left-style”>none</xsl:attribute>
<xsl:attribute xdofo:ctx=”block” name=”border-right-style”>solid</xsl:attribute>
<xsl:attribute xdofo:ctx=”block” name=”border-right-width”>0.5px</xsl:attribute>
<?end if?>
Repeat this for the other two areas (CO and CN), but replace the =’MOD’ with the correct code.
Highlight each of the Text to Display values (M, C, N in the example) and reduce their size to 1pt.

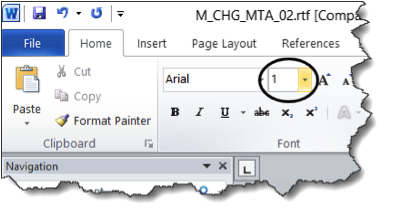
This will eliminate extra space above the embedded table data.
These two simple Word features, Tables and Borders, add structure and visibility to k
