JUNE 2016

PRIMAVERA P6 8x, CONTRACT MANAGEMENT 14x AND UNIFIER 16x

CREATING DASHBOARD REPORTS IN ORACLE BI PUBLISHER

DOWNLOAD THE PDF HERE


ABSTRACT

An often requested feature in reporting is the development of simple “Dashboard” reports that summarize project information in an easy to read graphical method.  This is commonly used for reporting statistics and other functions. While there are other tools available for this kind of reporting, latest versions of P6, Contract Management and Unifier all use Oracle Business Intelligence (BI) as the reporting engine, and this kind of reporting is available using BI.

BI also has the ability to connect to other data sources than these three, so depending upon your Oracle licensing in place, you may be able to apply this tip to other data sources than the three listed.

Note:  This tip presumes that you now have basic working knowledge of both Oracle Business Intelligence and also the underlying data source you want to display.   For the purposes of this exercise, we’ll be using the Primavera Contract Management data for the example.

Creating your Data Model:

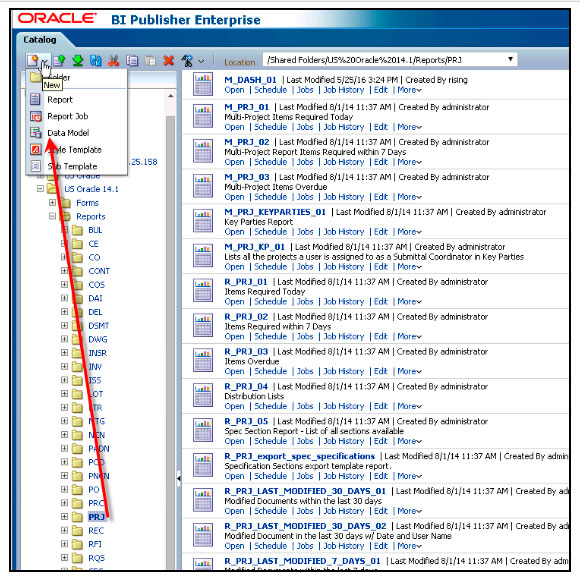
  1. In the Oracle BI Publisher Enterprise screen, you will want to create a data model that corresponds to the information you want to display. Navigate to the Catalog and find the folder where you want to store this report.
  2. Select NEW Data Model.
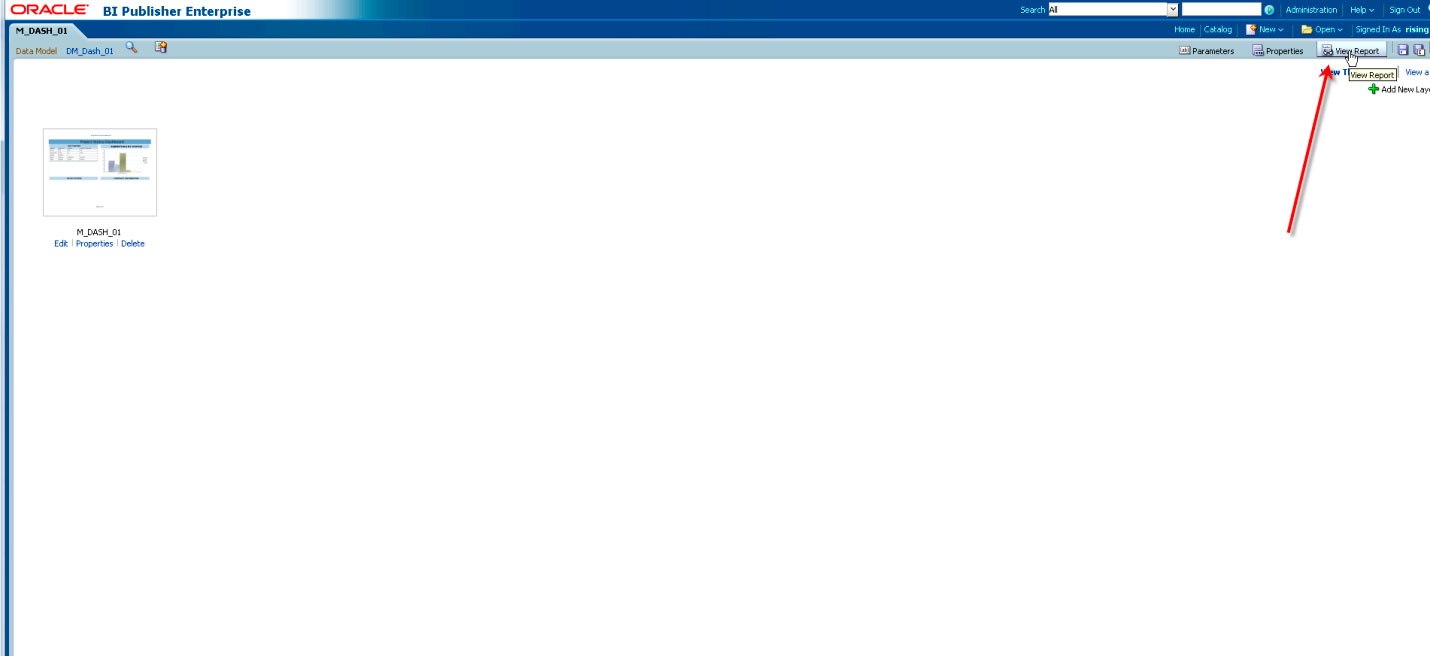
Figure 1


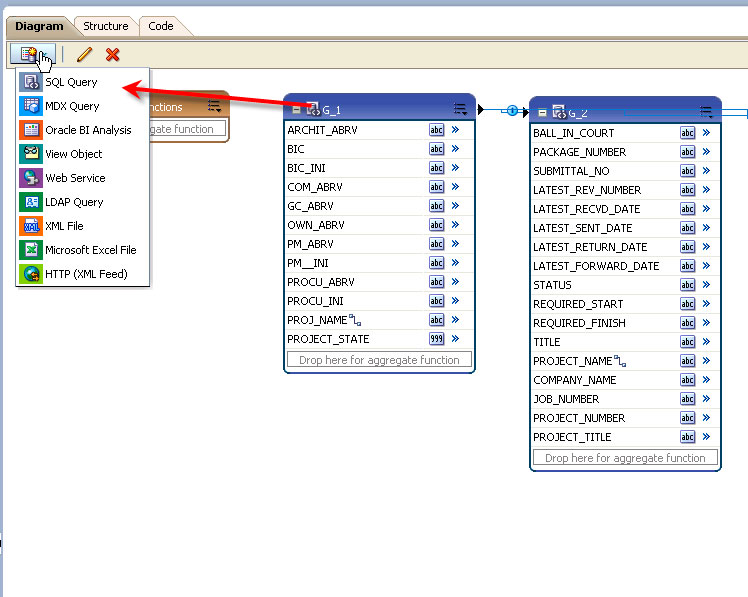
  1. In the Data Sets screen, add your data sets as appropriate, using SQL Query option.

Figure 2


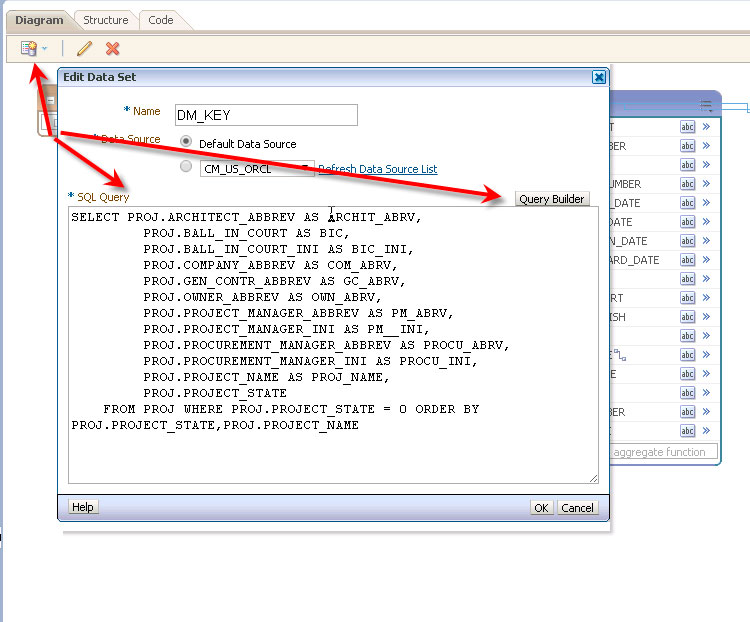
  1. Name your data set logically so that you know the source of the data, and select the correct data source from the list.
  2. Either type your SQL query or copy/paste from other data models. You can also use the “Query Builder” option if you want to build your query that way.
    1. In these examples, we copy/pasted SQL statements from three or four other reports.
  3. Click OK to close the Data Set window.

Figure 3


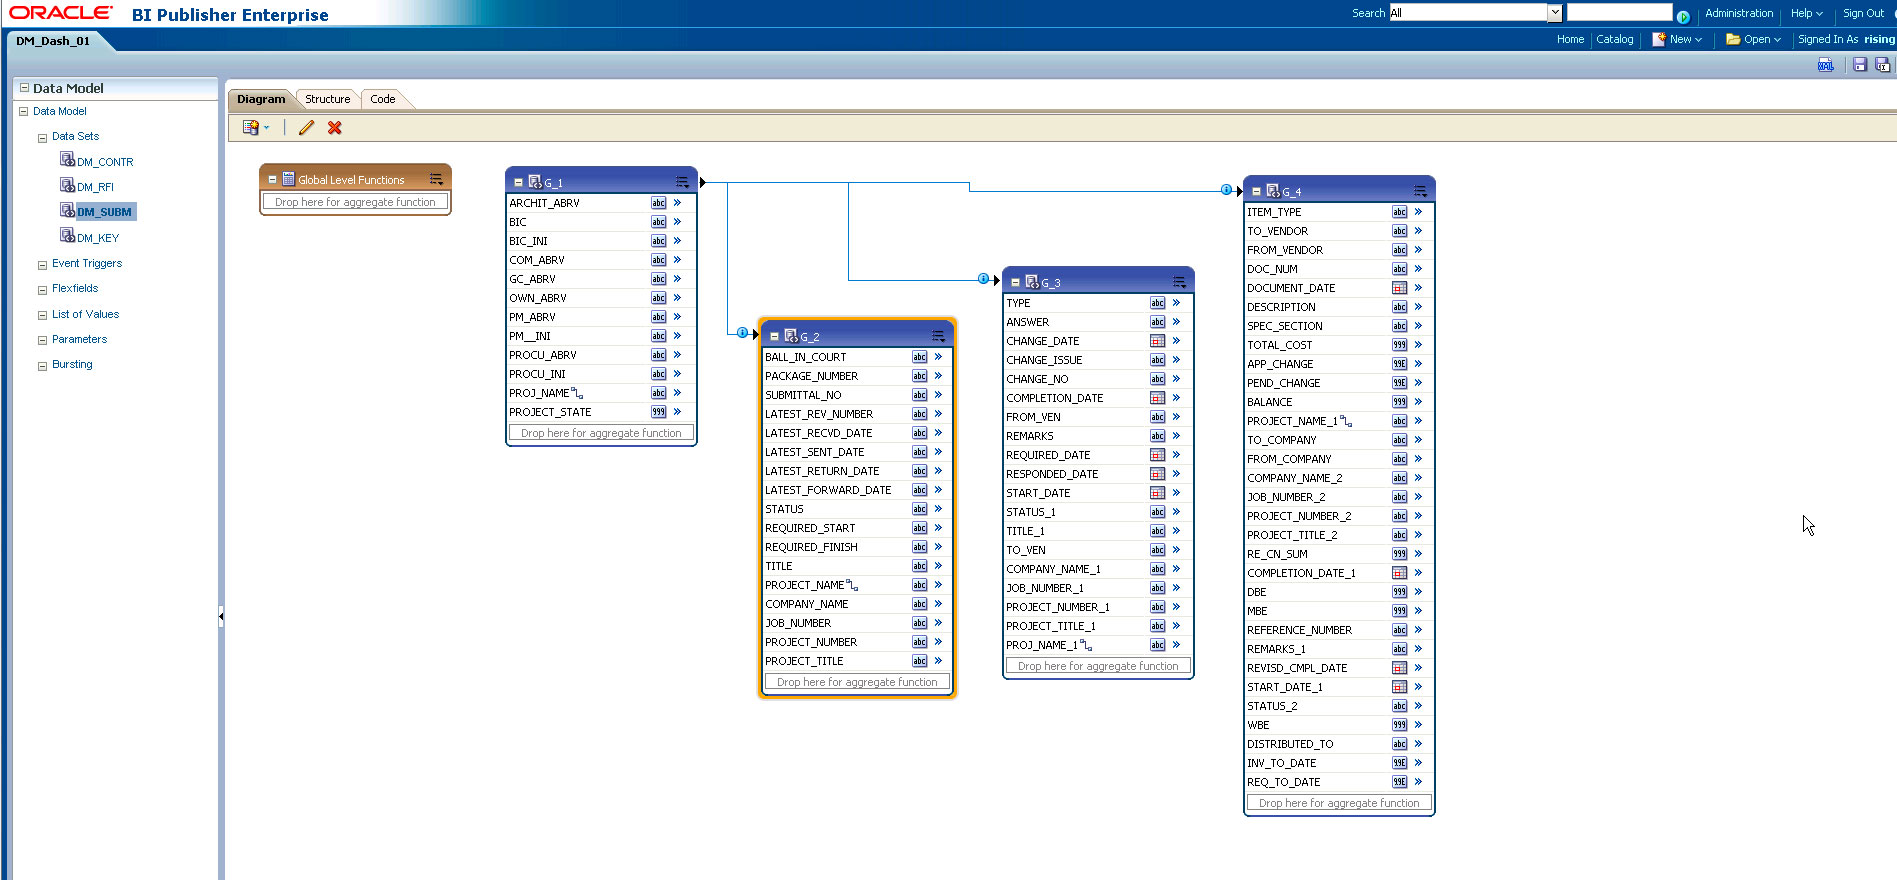
  1. Repeat with any/all other data sets.
  2. Next, link your data sets (as appropriate). In this example all were linked via the PROJECT_NAME criteria.
  3. If you have any Parameters or List of Values required for your report, add those in.
    1. In this example, there are no parameters.
  4. “Save. Save. Save.” Click the SAVE button to save the data model.

Figure 4


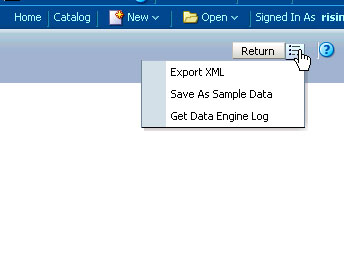
  1. Next Generate sample data if you haven’t done so already by clicking the XML icon.
    1. Type in any parameters, select number of rows to retrieve (i.e. 5 ) and then click RUN
  2. Select “Save as Sample Data”. (Note:  If you wish to build a layout in the BI Publisher Desktop, you would use the “Export XML” to save an external copy to work on locally.)

Figure 5


  1. Save and return to the catalog to create your layout.

Creating your Layout:

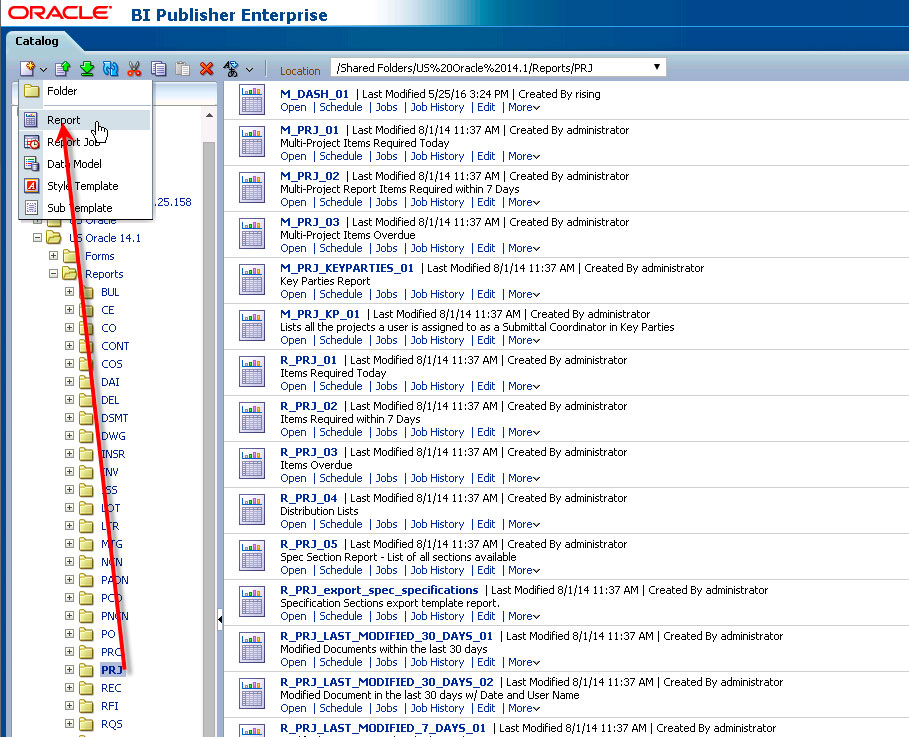
  1. Selecting the folder you want to use, select the NEW, Report option.

Figure 6


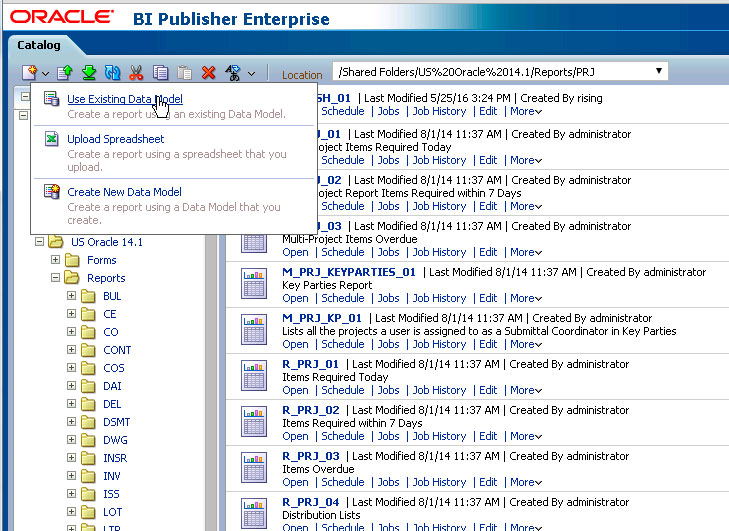
  1. Pick the “Use Existing Data Model” option—since you have already created the data model.

Figure 7

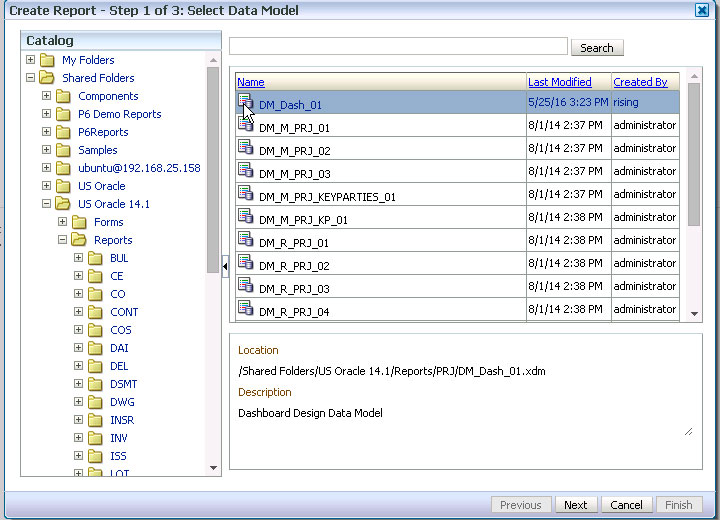
Figure 8


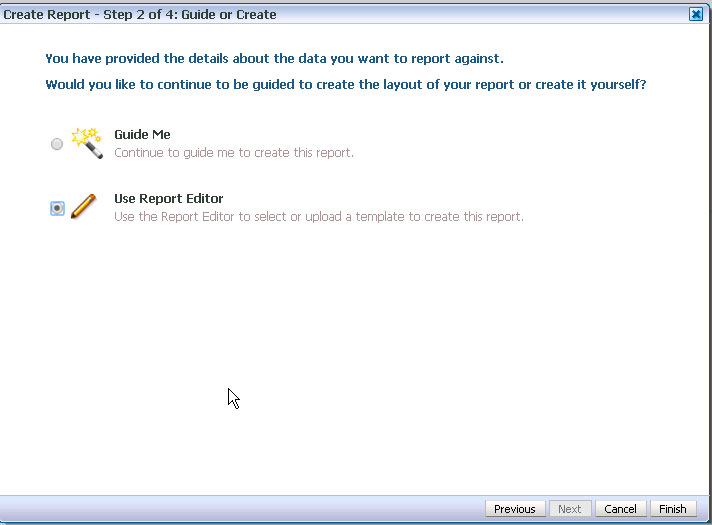
  1. After selecting your data model, select “Use Report Editor” and then click “Finish” to exit the wizard.
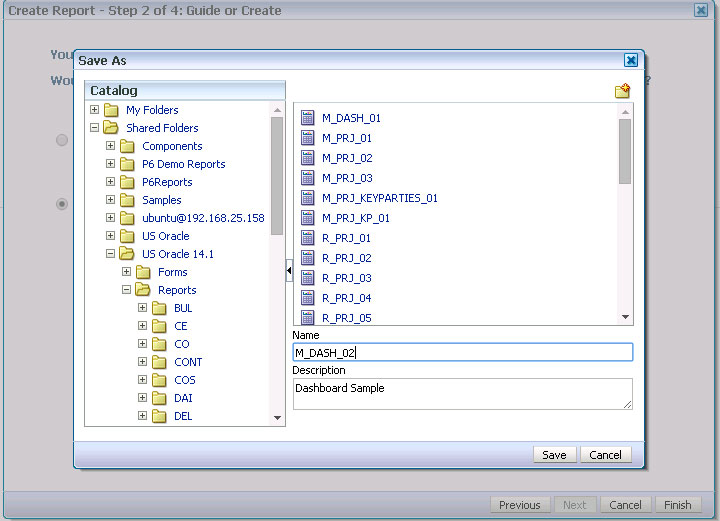
    1. This will prompt you now to name the report and save.

Figure 9

Figure 10


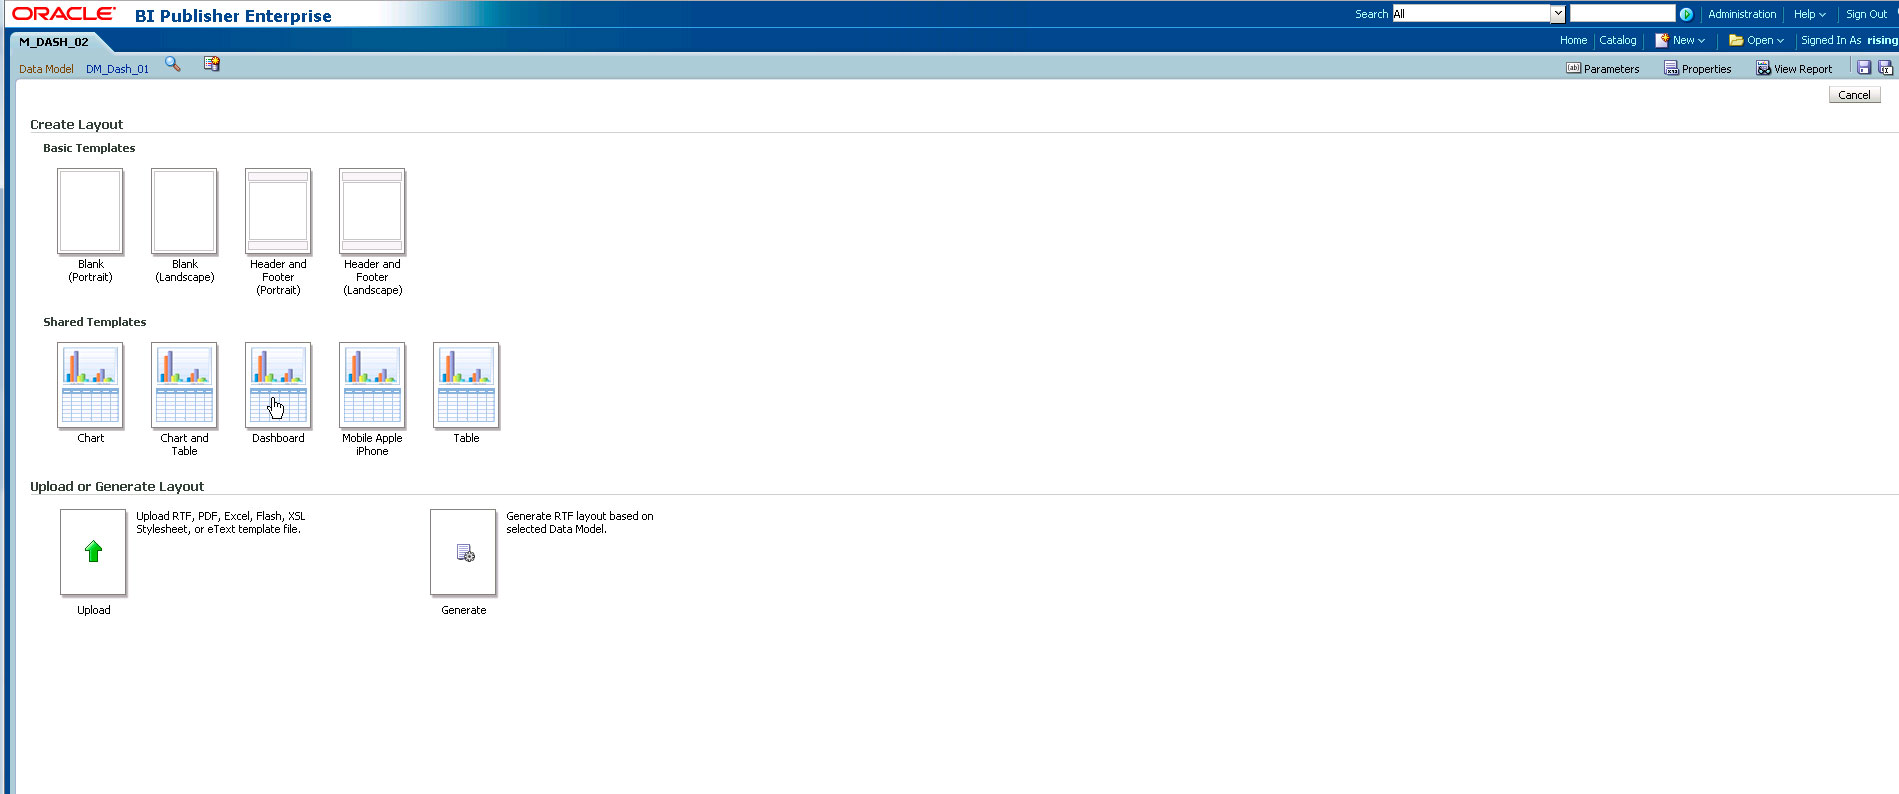
  1. Next, in the Create Layout window, you will select the “Dashboard” option from the Shared Templates, which sets up a graphical quadrant style one page report.
    1. Note:  If you want to use BI Publisher Desktop, you’ll exit BI Enterprise web screen and develop your layout in Word and then use the Upload RTF option when completed.

Figure 11


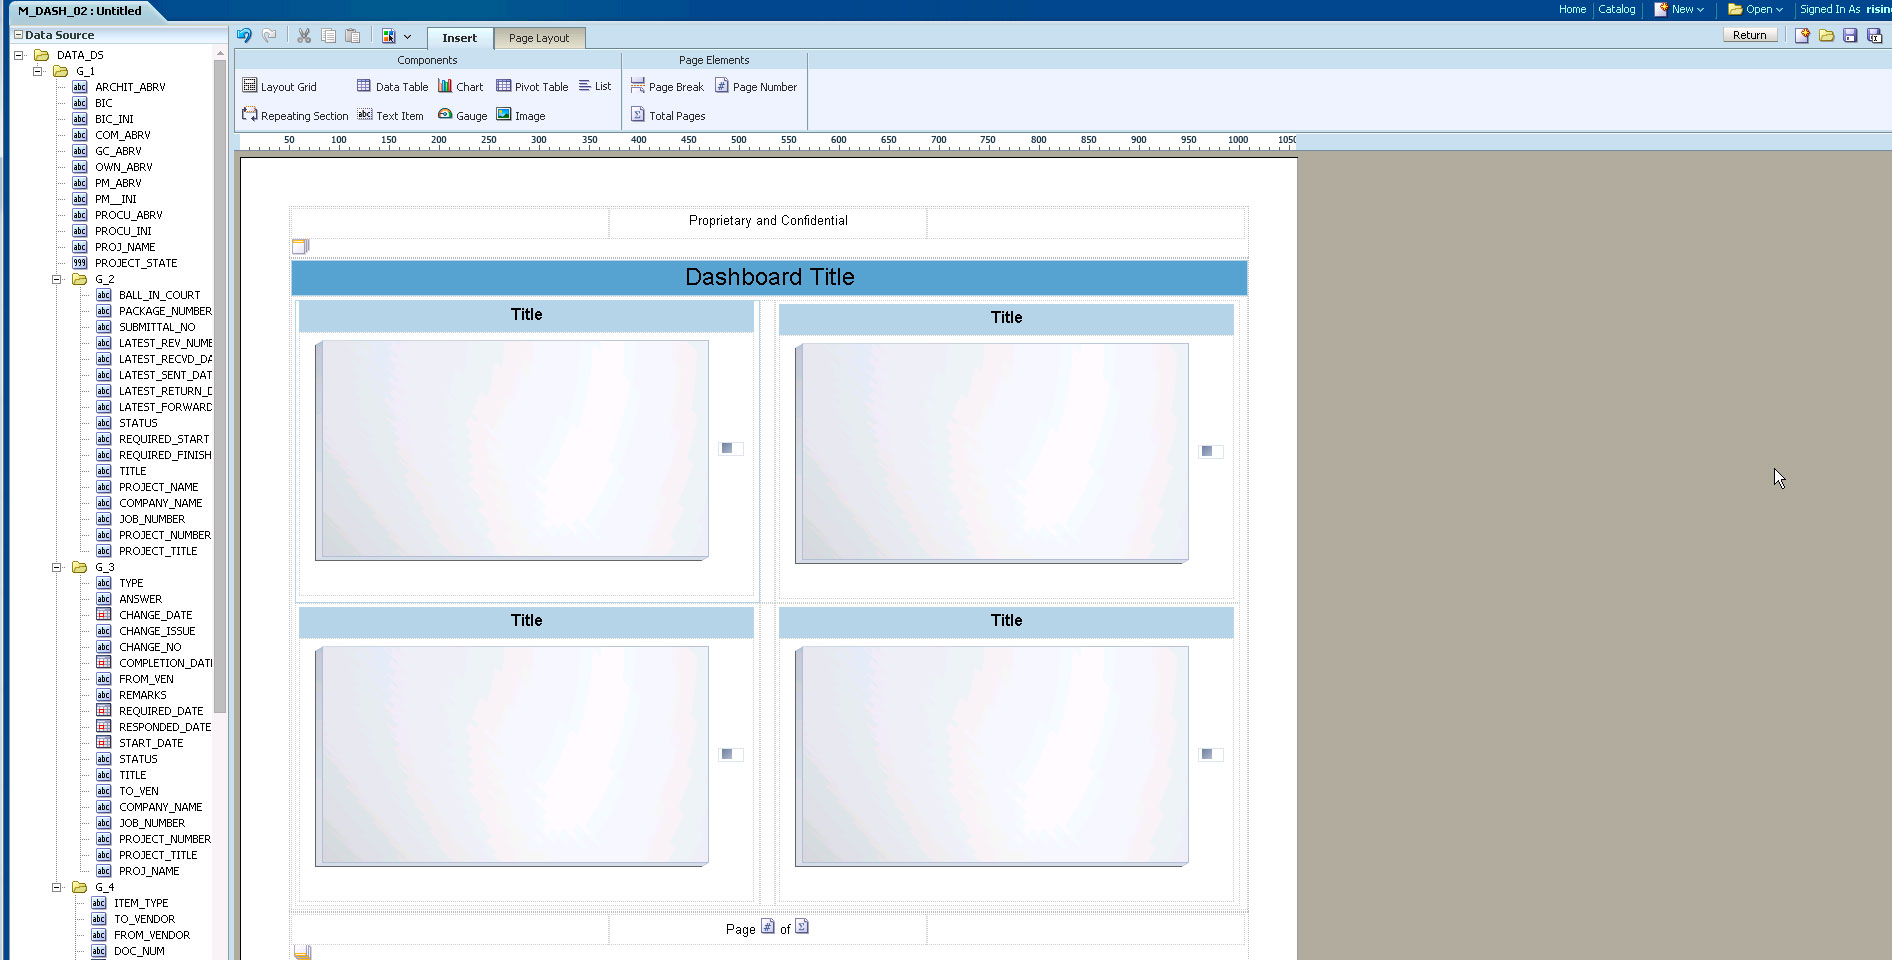
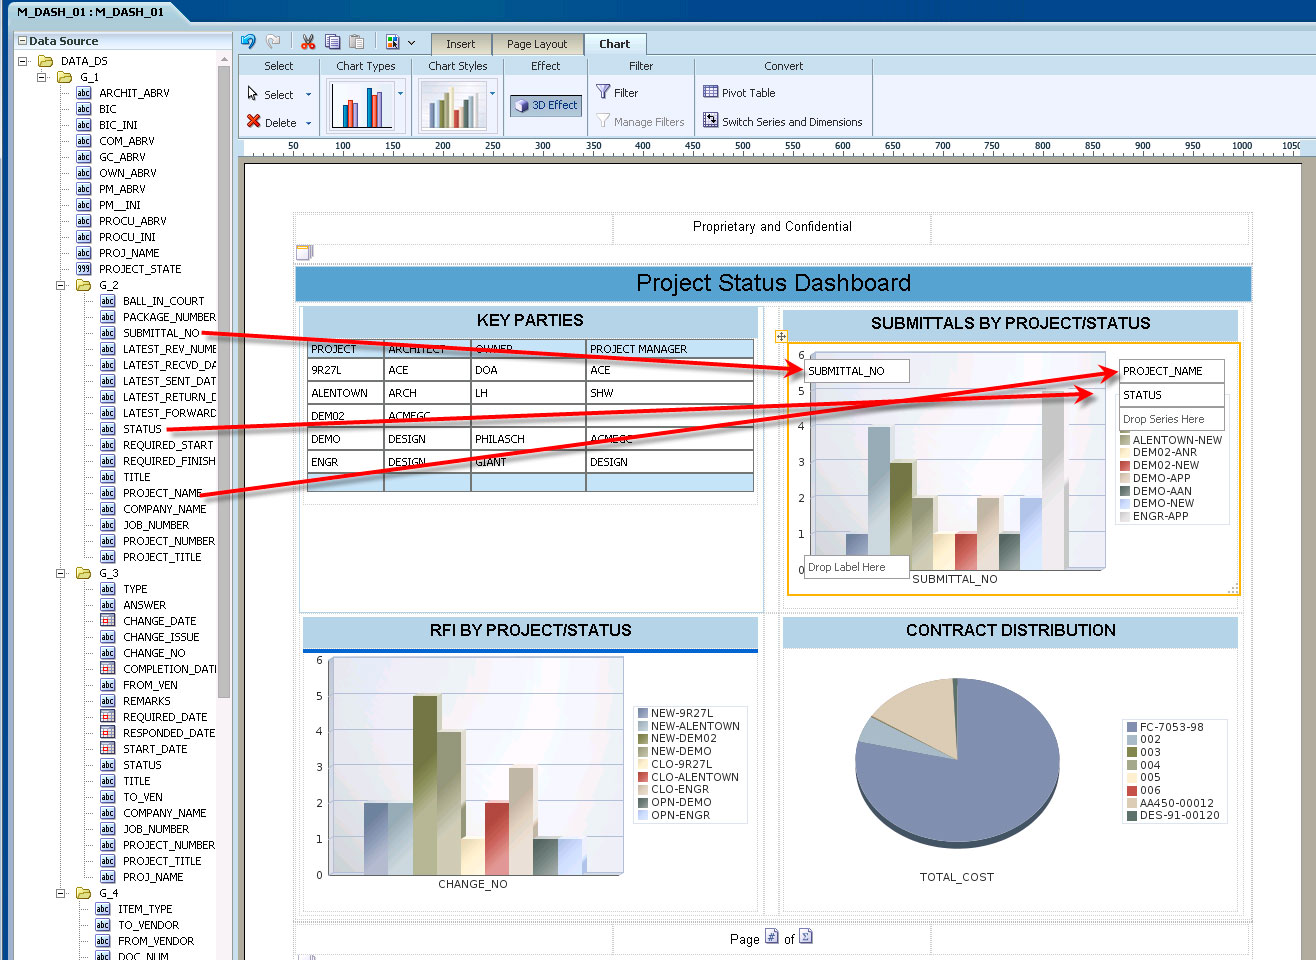
  1. Next, you simply drag and drop the appropriate elements into each block. If you click on the block, you’ll be able to select the Chart properties in the toolbar.  This Design also includes Title blocks for each quadrant, and you can modify the header/footer to suit your needs.

Figure 12

Figure 13


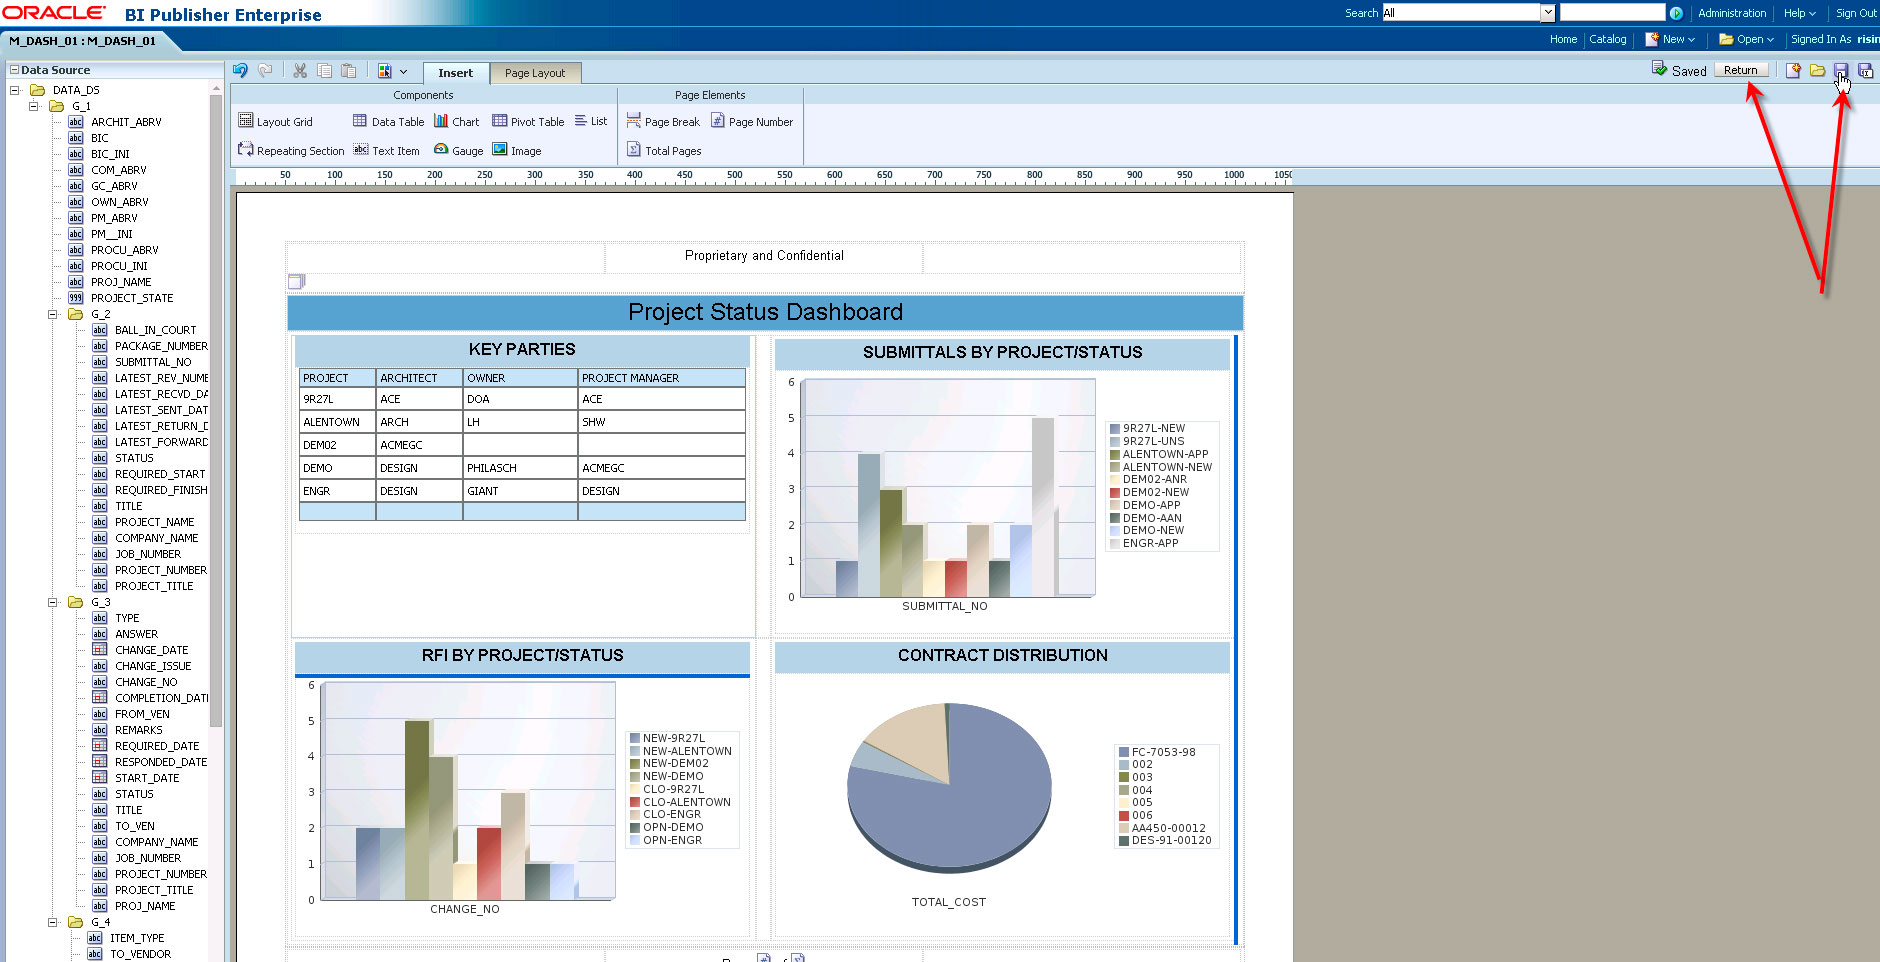
  1. Once you’ve saved the layout, you can click “Return” to go back to the main report screen. In the upper left, you’ll see the Data Model listed—make sure it’s the right one.

Figure 14


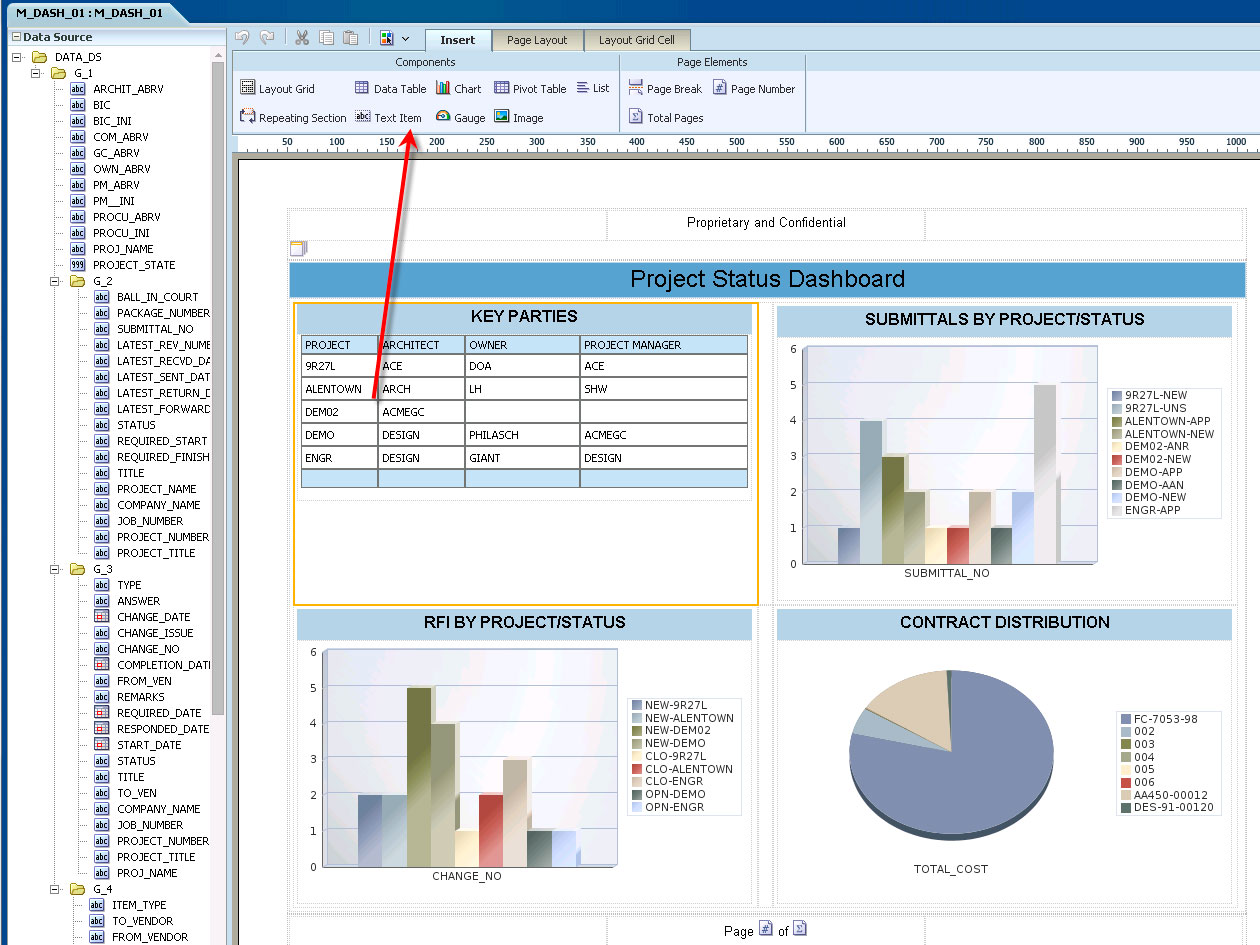
  1. If you want to change the element in the quadrant, you can remove the graph inserted and use the Insert tab to insert other objects (tabular, Gauge, etc.). Use the Insert to insert logos where appropriate, or images.
  2. Also, if you want to design a different layout, you can remove this quadrant design and using the Layout Grid set up your own design.

Figure 15


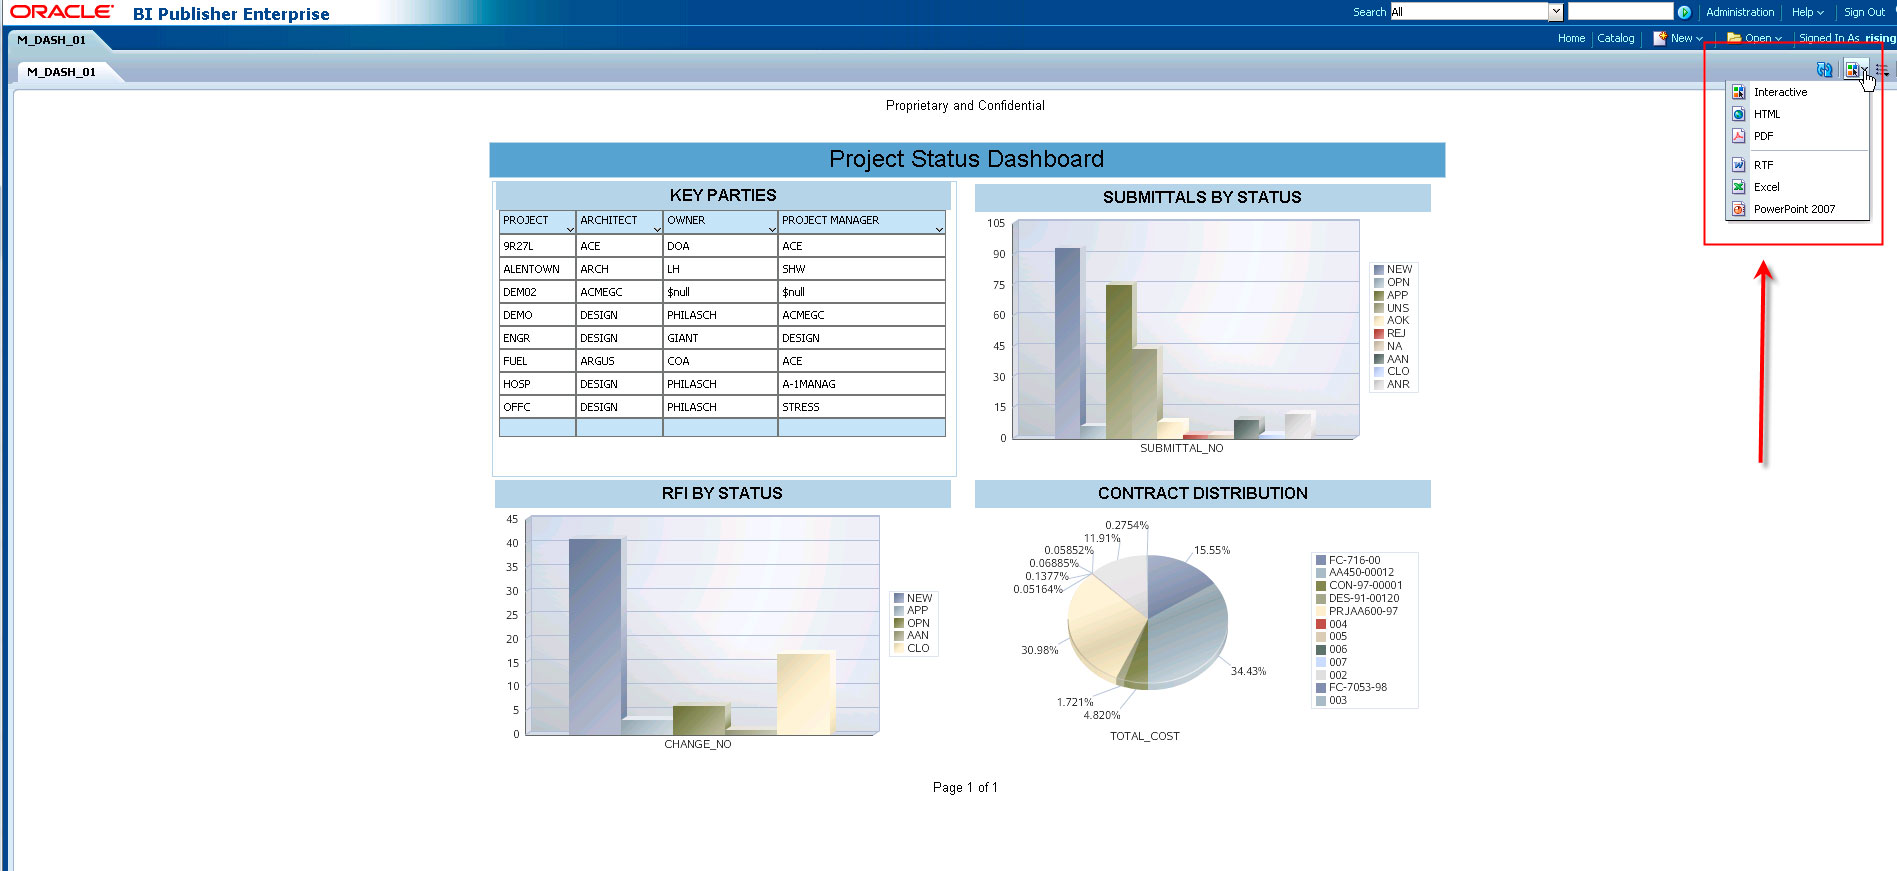
  1. On the upper right there’s a “View Report” which you can use to preview the output.
    1. Note: There are different output types, and not all of them are supported by all applications.  For example, Contract Management ONLY displays reports in PDF output method; however, P6 supports many of the other options, and Unifier supports multiple, though not all output methods.
    2. Best practice would be to preview the method that users will see.

Publishing and Previewing your Report:

  1. Once you’ve saved the layout, you can click “Return” to go back to the main report screen. In the upper left, you’ll see the Data Model listed—make sure it’s the right one.
  2. On the right, there’s a “View Report” which you can use to preview the output.
    1. Note: There are different output types, and not all of them are supported by all applications.  For example, Contract Management ONLY displays reports in PDF output method; however, P6 supports many of the other options, and Unifier supports multiple, though not all output methods.
    2. Best practice would be to preview the method that users will see.

Figure 16

Figure 17


  1. In the Report Layout screen, there are two options “View Thumbnails” and “View a List”.
    1. In the View a List option, you can select which Output formats are available, and which is the “Default”. For applications like P6, this will impact the view in the application; for some like Contract Management, they will have no impact; the report will automatically display as PDF.

Figure 18


  1. Lastly, you may have to perform certain functions inside the native application (like a report list import) for this new report to appear.

Summary

In summary, you can quickly build a graphical report using BI that displays MULTIPLE sets of information that can publish your key information.  In the example we used all the defaults, but you can customize it to match your needs.

A picture is worth a thousand words, they say, and that often applies to high level management reports.  Since you are retrieving the data from your main dataset, you can use your detailed log reports as backup to this.