JULY 2016
ASTA POWERPROJECT
CONFIGURING THE BAR CHART VIEW
DOWNLOAD THE PDF HERE
ASTA Powerproject provides several tools and methods to customize your bar chart view. This feature enables understanding and communicating of key details in your schedule.
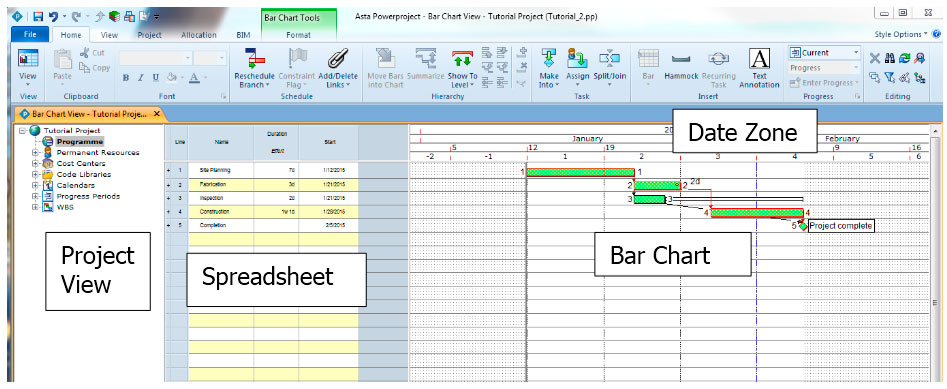
In the typical Asta view, there are several views or components; in this tip we will be focusing on the “Bar Chart” area.
Bar Chart
A cool feature in Asta is the Formatting icons toggle to show/hide many features contained within the Bar Chart view.
Left to right on the top row, the boxes are as follows:
- Free Float
- Total Float
- Critical Path
- Progress Line
- Progress shading
- Non-driving links
- All links
- All Constraints
- Annotations
- Baselines
- Gridlines
- Ruling lines
- Demand allocations
- Schedule allocations
|
Left to right on bottom row, the boxes are as follows:
- Cost allocation
- Empty RBS/CBS lines
- RBS/CBS Summary tasks
- Date Zone
- Non-Working Shading
- Standard working shading
- Vertical Shading
- Project view
- Barchart
- Histogram
- Line of Balance view
- Marked items
- Unassigned Tasks view
- Resource Usage view
|
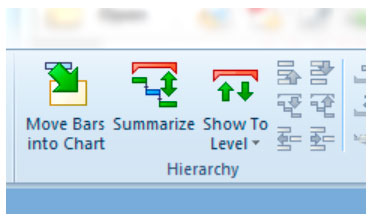
Summarize
Useful for grouping similar tasks (related by area, resource, etc). Summarize feature allows you to roll up and show a summarized view (fewer activities). To build summary tasks, highlight the bars desired to group together, click on the Summarize command.
To add/remove other activities to include in Summary bars, simply highlight the desired activity, then click on the indent (add) or outdent (remove).
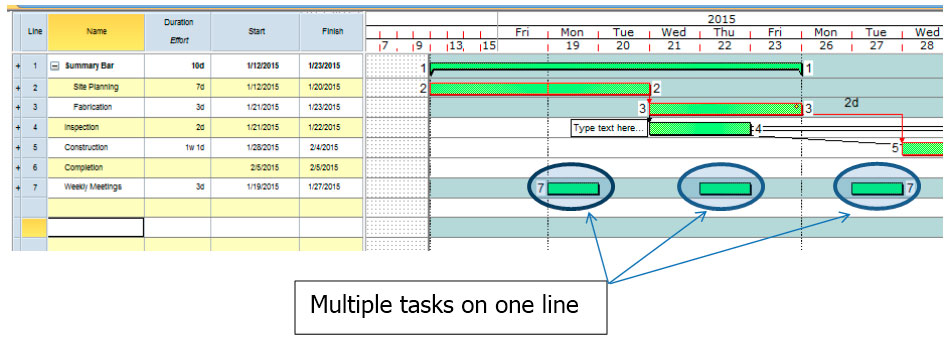
Multiple bars on one line
This feature allows you to display more than one task on a bar. Weekly meetings would be a good example. Simply draw tasks in the Bar Chart area using the cursor.
To expand (show all tasks on separate lines), click on + sign (to left of task name).
Or, click on the Unroll Tasks function.
Add Annotations
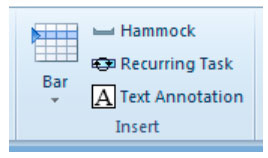
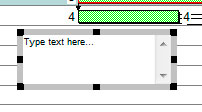
Good for adding text to specific bars on the chart. To add text boxes, click the Text Annotation command.
Move cursor to the bar chart area, left click and drag mouse down and to the right. This draws a text box
Annotations can be attached to the task so as the task moves in the schedule, the text box moves with it. Grab the Annotation box, drag to the activity wanting to be attached to. As you get close to the end (left or right), the cursor symbol will change to an arrow in a box (attaching to before or after the task).
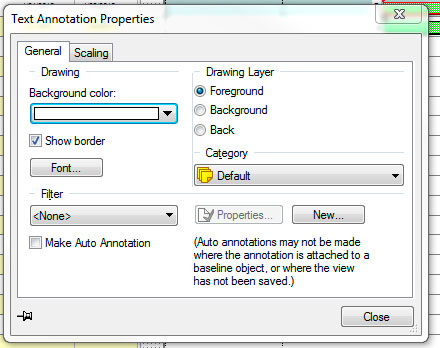
To modify Text Annotation, left click box (select), then right click and select Properties. Here, Background color, border, font, category can all be selected and changed as desired.

