PRIMAVERA CONTRACT MANAGEMENT
DOWNLOAD THE PDF HERE
Primavera P6 serves as an important tool for forecasting an organization’s available work capacity. The level of detail in which the activities are built will determine where users will assign Roles/Resources. The graphic below illustrates how each element in P6 can impact each other. When the schedule dates change, Resource Units can automatically adjust, in turn affecting Expense & Resource costs. Primavera P6 settings also allow for complete manual update of each element of the triangle.
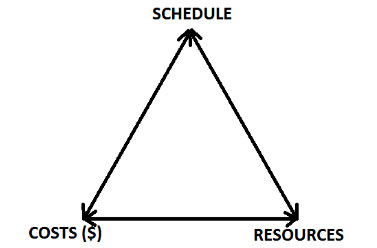
This tip presumes the reader already has a basic understanding of Roles and Resources. When an organization properly plans out how they will manage the schedules, they will start with Role assignments first, then Resources (unless the schedule uses the Resources by Role).
Using P6 histograms is an effective way of managing a user’s resource assignments.
Assigning the Role/Resource to an Activity
The first step or requirement is to assign resources or roles to the appropriate activities. This is done on the Resources tab of the activity. The budgeted units should be manually adjusted to accommodate an accurate number of hours for the work to complete.

Reviewing Resource Usage
Once every activity requiring a role or resource has been assigned to the project or all projects, we can begin the analysis process by choosing the “Resource Usage Profile” icon.

The Histograms can be toggled to show Resources or Roles. For this example, we will look at Roles only.
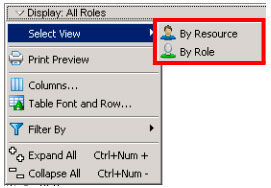
When open, users will see a representation of the Roles assigned to all activities requiring the specific work. The left side is the Role hierarchy which correlates with the bar histograms on the right side. The bars will automatically adjust as the user selects different assigned Roles on the left.
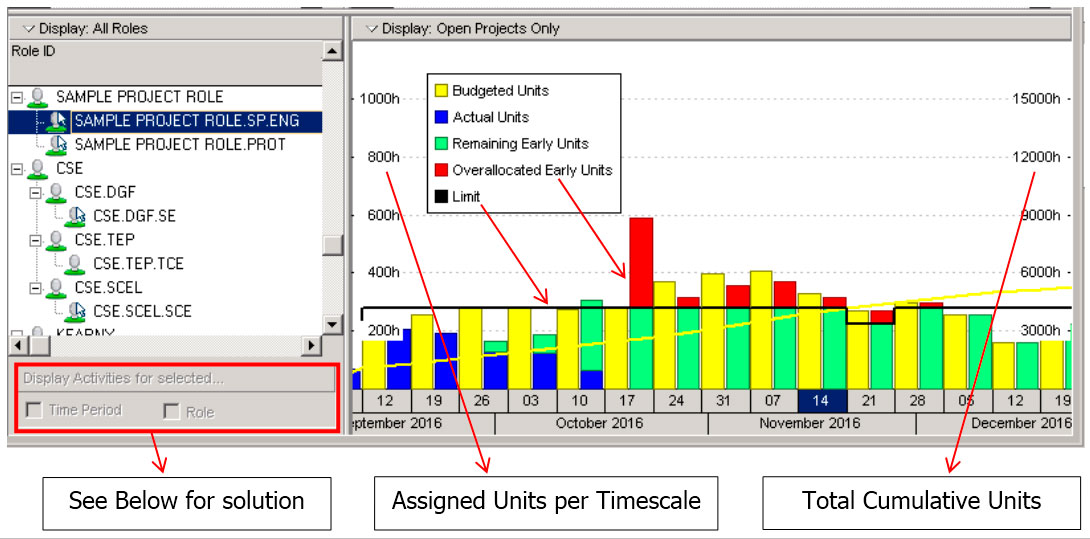
This will graphically show users utilization, including over-allocations which might occur. Users can also review this by open projects or all projects – valuable if their resources are assigned to multiple projects.
Solution for “Display Activities” Greyed Out
If the “Display Activities for Selected…” is greyed out, user must select the upper right Display Options Bar, and un-check “Show All Projects”. Note the Role Usage Profile Options for the next screens below:
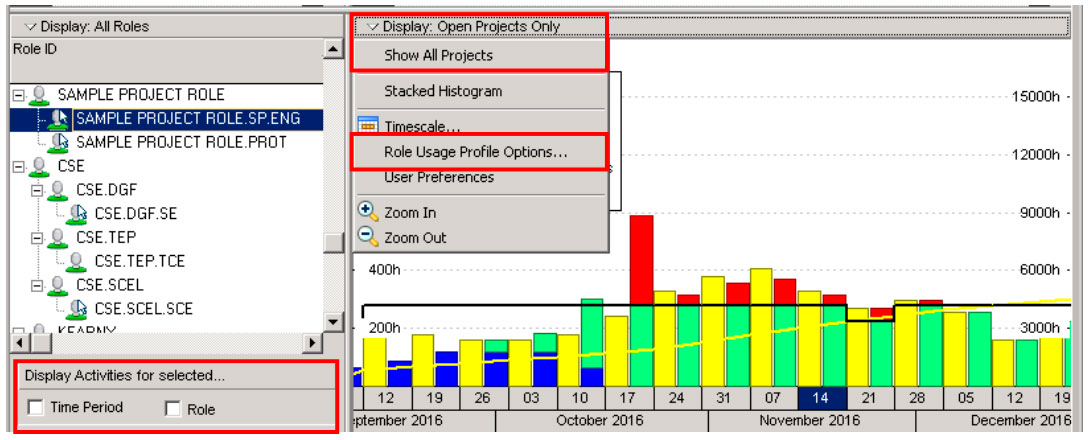
Role Usage Profile Options
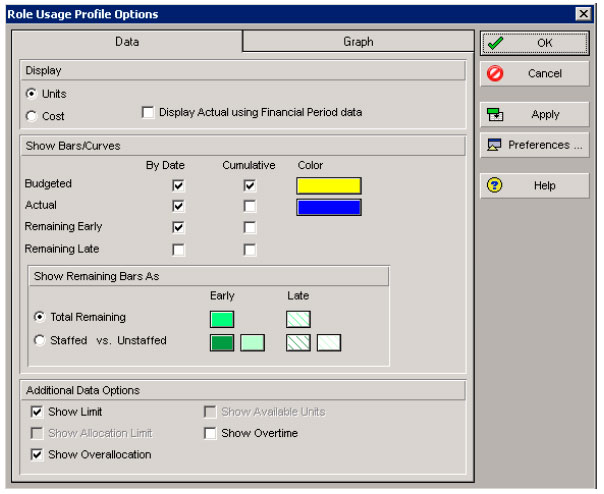
Selecting Role Usage Profile Options provides users with a number of ways to configure this graphic.
The Data Tab
The histograms are dictated by the Role Usage Profile Options. If there is a budgeted price per unit, users can toggle to show units or costs in the histogram window.
Users can also toggle off various units for reporting, including the difference between the Early Units and Late Units for an activity’s remaining duration. Select the “Cumulative” checkbox next to the data type to show a curve on the histogram.
The Graph Tab
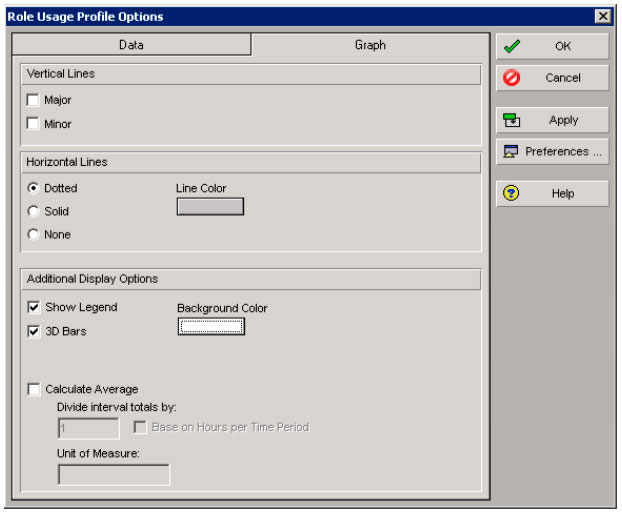
Users can choose to show guidelines for the timescales, customize the background colors for reporting, or can calculate averages for Full-Time Equivalences (FTE’s) and represent outcomes on the histograms.
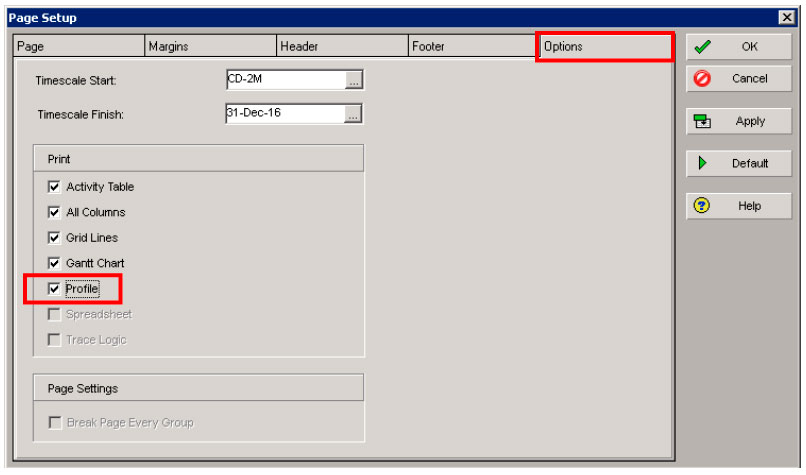
When opening the “Page Setup” icon within the print preview window, users can select the “Profile” checkbox to report a histogram in a graphic report. These settings can be retained when saving an activity layout.
Final Conclusion
Using Primavera P6 for Role and Resource management is extremely robust and users should become familiar with the functionality as this tech tip covers a small percentage of the true software capabilities. For schedules that are driven significantly by the Roles/Resources used on the project, use of the histogram view can greatly assist in the proper analysis and preparation of the schedule.
