ORACLE PRIMAVERA P6
DOWNLOAD THE PDF HERE
The Progress Line is a function of Primavera which allows users to graphically represent a variance between a set of user defined data points in the Gantt chart.
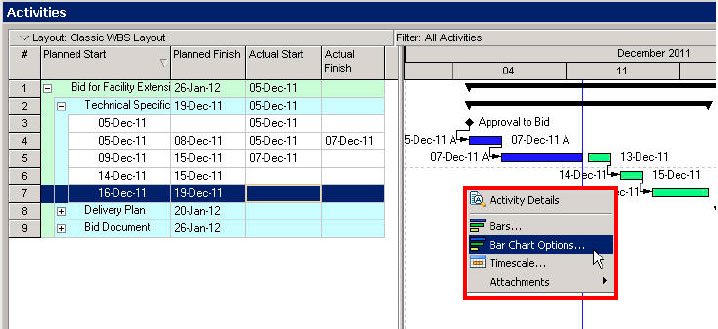
Data Points can be chosen by right-clicking in the Gantt chart and selecting “Bar Chart Options”.

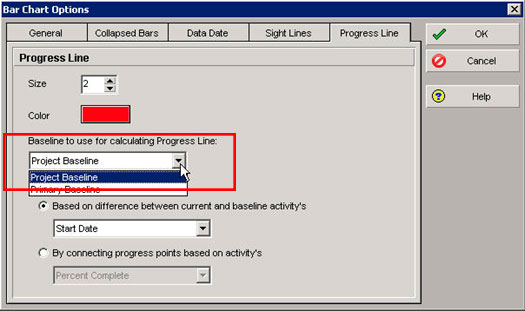
Select the progress line tab and choose the Baseline in which you will be comparing against.

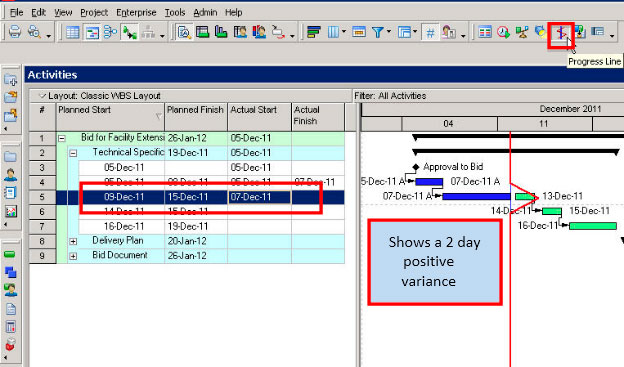
It can be quickly turned on by selecting the “Progress Line” icon.

In this example on Line 5, we can see the variance comparing our Planned Start vs. our Actual Start Dates.
