ORACLE PRIMAVERA UNIFIER & ORACLE PRIMAVERA P6
DOWNLOAD THE PDF HERE
To utilize dates from a P6 schedule to create a cash flow curve in Unifier based on cost business process data. This tech tip details the steps to do this.
The following example uses the Unifier base product Cost Controls application.
Pre-Requisite Set Up
Unifier:
- Unifier project (shell) has been created using the base product shell template – this will include the default Data Mapping required in the schedule sheet.
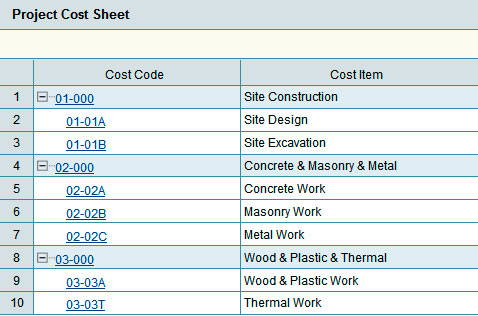
- Unifier CBS Cost Codes have been created in the cost sheet for the Unifier project.
- Cost sheet data has been populated using a base product cost business process. The example uses Budget Approvals and budgets two Cost Codes.
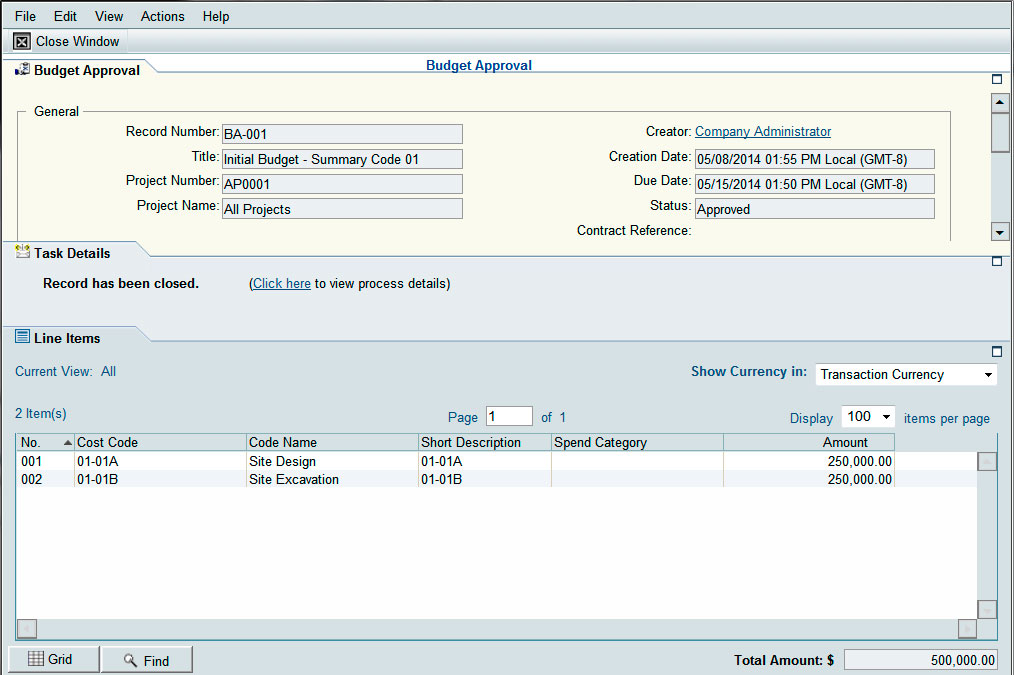
Cost sheet view of the cost business process record. Two Cost Codes have budgets against them.

P6:
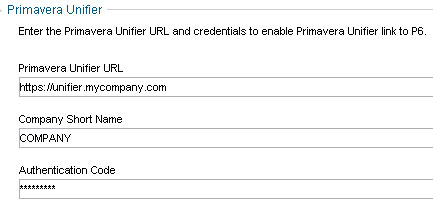
- P6 Application Settings have been set with the correct Unifier environment settings – this creates the association between P6 and the Unifier environment.
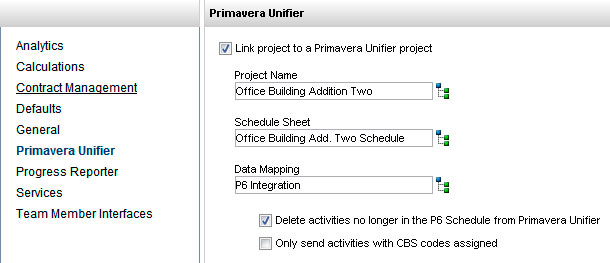
- Unifier Project Settings for the P6 schedule has been set in Project Preferences – this links the P6 schedule with the Unifier project.
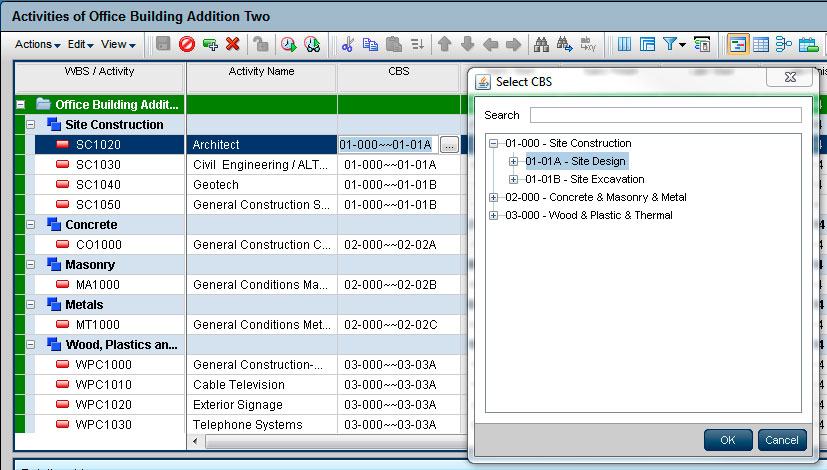
- CBS Cost Codes (from the Unifier project’s cost sheet) are assigned to Activities using the CBS column.
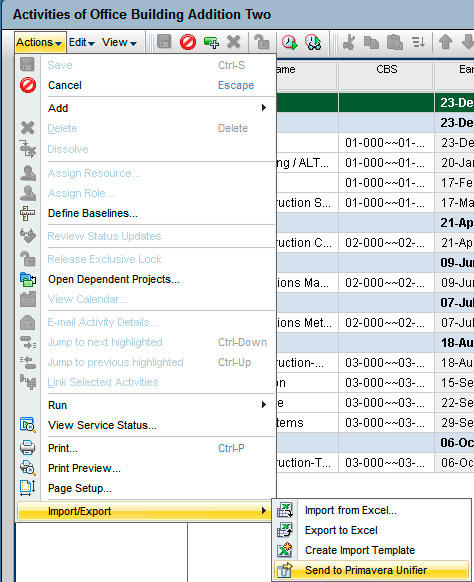
- P6 schedule has been sent to Unifier.
- Check the P6 schedule data has been populated in the Unifier project’s schedule sheet.
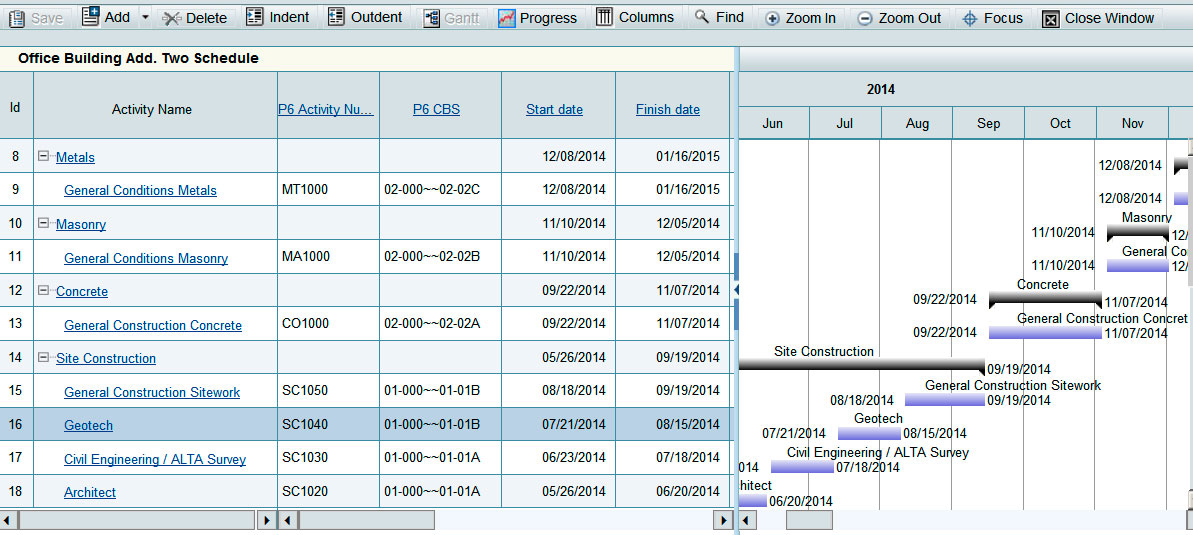
Creating the Cash Flow Curve
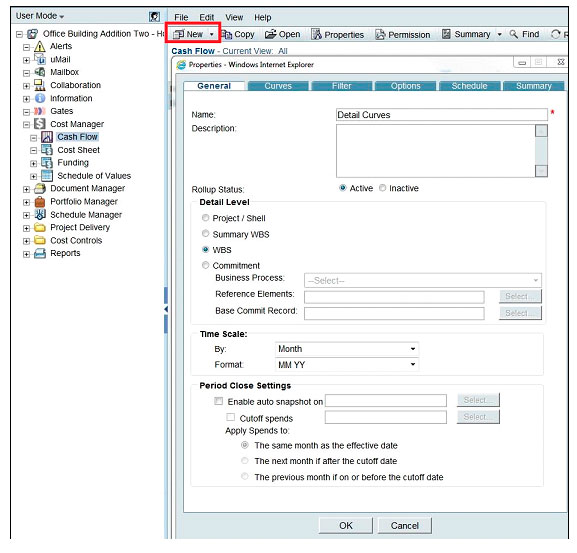
- In the Cost Manager of the Unifier project:
- Select Cash Flow node.
- Click New and select Detail Curves.
This will create the detail level the curve data will be based on.
- In the General Tab:
- Provide a name.
- Select WBS (the curve will use the CBS Cost Codes).
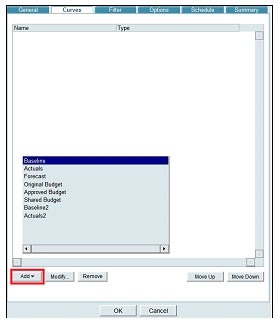
- In the Curves tab:
- Click Add and select a curve. The curve selected in this example (baseline) is one of the default curve types (Baseline, Actuals, Forecast) from the Cost Controls application.
- Click Ok to close window.
A distribution profile (curve type) will be assigned to each CBS Cost Code.
- In the Distribution section:
- Select ‘Auto by default profile per WBS’ radio button.
- Click Details.
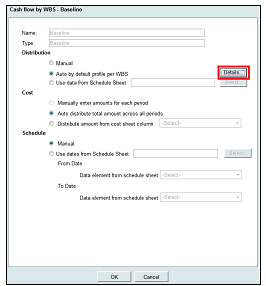
- Select all the rows to take advantage of the Bulk Edit feature.
- Click the Bulk Edit.

There are four default profiles to pick from: Linear, S Curve, Front Loaded and Back Loaded.
- In the example the S Curve is selected:
- Select the desired row.
- Click Select.
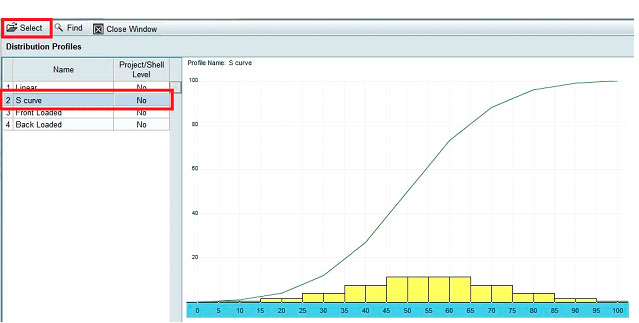
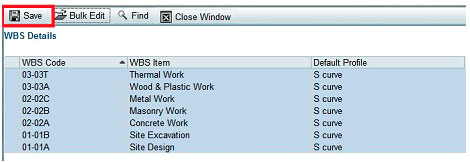
All WBS Code (Cost Code) rows now have the distribution profile S Curve.
- Click Save will also close the window.
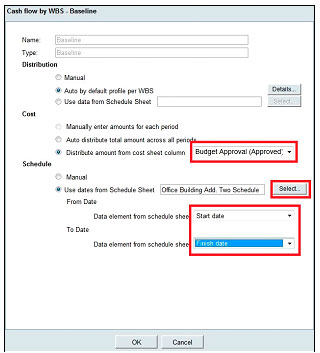
The curve now needs to know which cost data to use from the cost sheet and also how the distribution will be allocated over time (in months). This example the Budget amounts are used and distributed over date ranges from the schedule sheet. These date ranges look at the earliest Start Date and latest Finish Date for activities per assigned Cost Code.
- In the Cost section:
- Select Distribute amount from cost sheet column radio button.
- Select the appropriate business process (with specific status). This example will use approved Budget Approval business process records.
- In the Schedule section:
- Select Use Dates from Schedule Sheet radio button.
- Click Select.
- Select Start Date for the From Date and Finish Date for the To Date.
- Click OK to close the window.
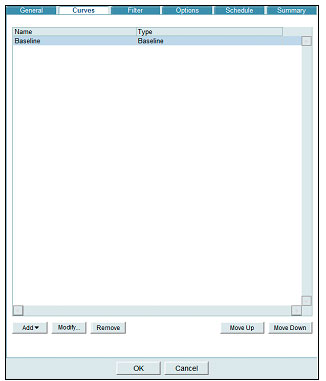
The newly created baseline curve is listed.
- Click OK to close the window.
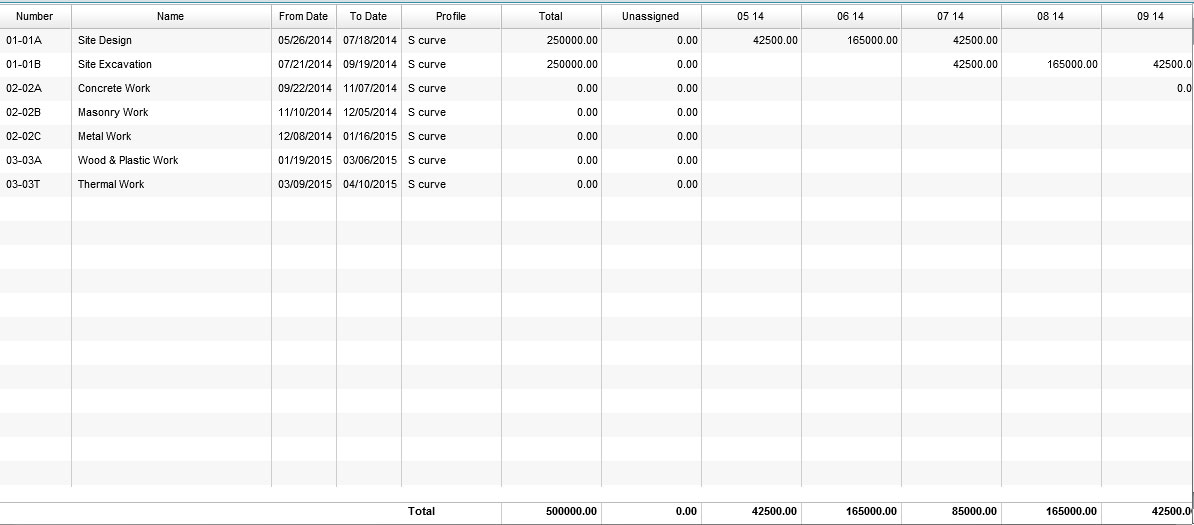
The cash flow curve window will automatically appear showing the example baseline curve. The rolled up summary budget amounts (per month) can be seen in the row in the bottom pane. The From and To Date represent the earliest Start and latest Finish Date of activities that have cost data assigned per Cost Code.
Selecting the row and clicking Open will bring up the details for the curve.
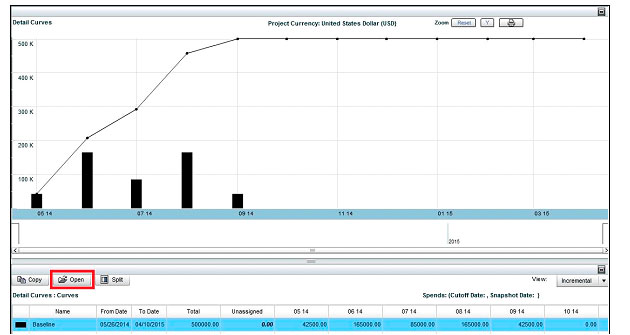
In this example there were two Cost Codes assigned to activities that had approved budget amounts. Note how each budget amount per Cost Code is distributed between the corresponding From and To Dates.
