
Overview:
Graphic functionality in P6 allows for multiple baselines to be displayed in the Gantt chart. This edition of Tech Tips will look at the steps required to enable this feature. Common sticking points will be discussed and some suggested methods for work arounds. The goal of this paper is to equip the reader with techniques providing visibility of multiple P6 baselines in the Gantt Chart.
Definition:
“A baseline is like a camera that takes a snapshot, not like a video cam that takes footage as the plan is updated.”[1] A P6 baseline is a copy of the project at any point in time, attached to the project. It can serve as a target comparison for measurement and tracking of planned versus actual progress. Each project can have multiple baselines, but only one “Project Baseline,” is assigned. Baseline will remain static as current schedule progresses.
- Zocher, Marc and Thompson, Gary, Cost and Schedule Baseline Development, 1992 AACE Transactions, H.3.1, AACE International, Morgantown, WV, 1992
Creating Baselines in P6:
Listed under the “Project Menu,” access the “Maintain Baselines” window. Click “Add,” to create a baseline for the schedule. This will bring up a dialog box asking to select between converting an existing schedule into a baseline for this project, or saving a copy of the current project as the baseline. Rename the baseline by double clicking underneath the project or inside the details field “Baseline Name.”
*For large programs, generally speaking, it is not recommended to create baselines for more than 50 projects at one time. From personal experience, the potential efficiency en masse isn’t worth all the rework due to errors or duplicates.


Assigning Multiple Baselines in P6:
Next step, return to the “Project Menu,” this time choosing the “Assign Baselines” window. In this example, two different baselines will be assigned to the project. One for the “Project Baseline,” and one for the “Primary” baseline. Use the mouse to select assignments, or tab through the fields and navigate choices with up & down arrows. Click “OK,” when correct Baselines have been assigned.

Bar Specifications in Gantt Chart:
Now the schedule is ready to display multiple Baselines in the Gantt Chart. We will be working in the Bar Specifications window. For a more thorough and detailed analysis, please see this Tech Tip: “UNDERSTANDING THE P6 BAR SPECIFICATION,” available here: https://drmcnatty.com/understanding-p6-bar-specification/
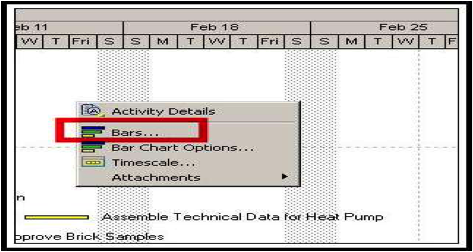
- Open the Bar Specifications Window in P6 by right clicking in the Gantt Chart and selecting “Bars,” icon. Alternatively, “Bars,” can be selected from the “View,” menu as well.
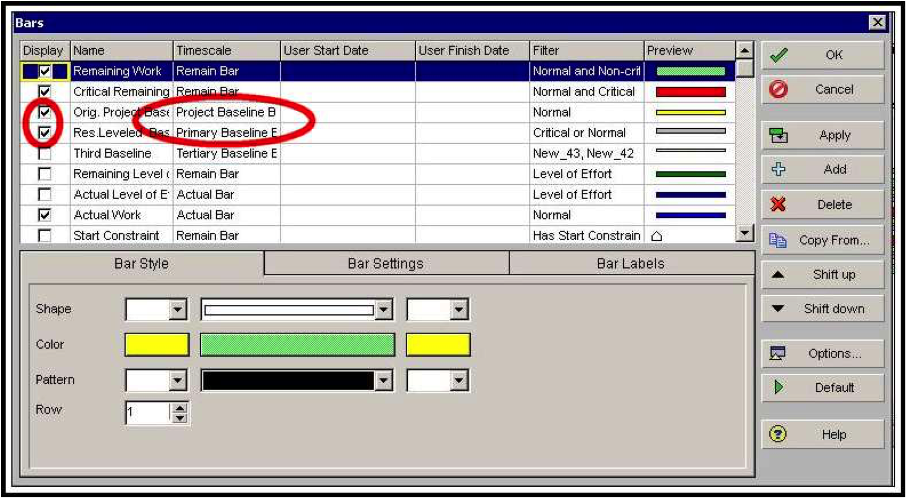
- Next, you’ll want to check the boxes to display both the “Project Baseline Bar” and the “Primary Baseline Bar.” If desired, there’s also Baseline Milestones which can be chosen as well. Then click “OK.”
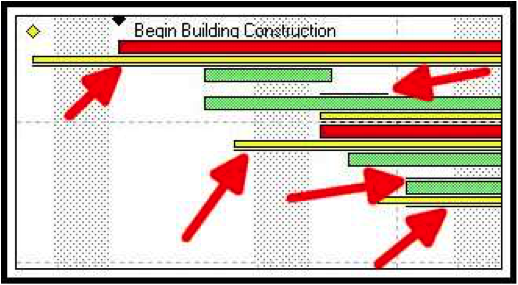
- Back in the Gantt Chart, both Baseline Bars should appear underneath the activities. Often, one Baseline Bar will be whole and intact. Below that only a single line may be visible (highlighted by the red arrows in the image below). This is actually the second Baseline Bar, in the next step we will work to make it fully recognizable.
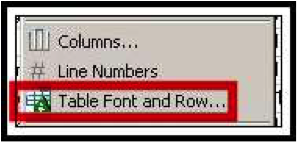
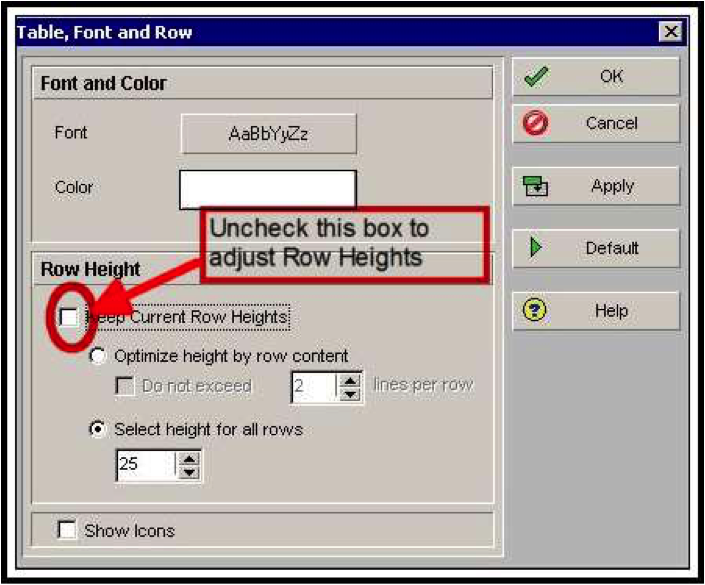
- From the “View,” menu, scroll down and select “Table Font and Row.” You can also hover over the Activity Table in P6, right click, and access the same “Table Font and Row.”
- For Table Font and Row options, the default Row Height is set at 18. This is not tall enough to see both Baseline Bars in the previous step. Increase the Row Height to 40 while working to make all the Bars visible. With proper editing, two thin bars should be able to fit underneath a thick bar at row height of 25. Starting out big will allow you to see what you’re missing and work with the material until you get to the finesse stage. Then bring the row height down, but not too much, otherwise it looks cluttered and the graphics might be too busy for non-schedulers.
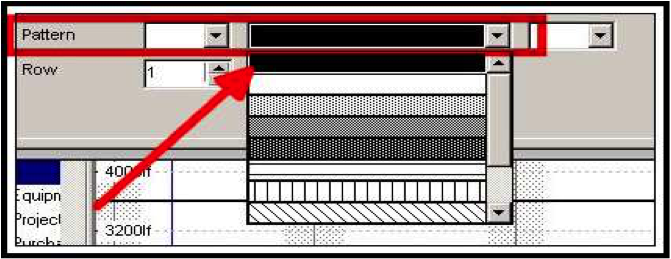
- Finally, there might be one other potential issue. Sometimes when selecting colors, the bar will remain white in the Gantt Chart. Go back into the Bar Specifications window (Step 1) and make sure that the pattern selected is solid black. This will allow for a solid fill of the bar, with any color of your choosing.
Reports:
When producing reports, either printed paper or electronic PDF, be sure to allow enough room for the Gantt Chart Legend to be fully displayed and not cut-off. This might require going into “Page Setup,” in the “File Menu” and increasing the section divider line (illustrated below). Another option is moving up to a larger paper size for example “Letter,” to “11×17.”The multiple baselines will at least double the number of items listed in the Gantt Chart Legend and it may get confusing for the audience if there’s no clear identification as to what each bar represents.

Summary:
P6 has the graphic capability of displaying multiple baselines in the Gantt Chart. This edition of Tech Tips outlined a few simple steps to activate this functionality. A few common challenges in the process have been identified and workarounds provided to ensure the P6 User is able to successfully display multiple baselines in the Gantt Chart.