ORACLE PRIMAVERA P6
DOWNLOAD THE PDF HERE
The Gantt Chart is an easy to understand, visual interpretation of a projects status. Most users find it very easy to assess the timeliness of a schedule by viewing the planned baseline bars and comparing them to the actual bars using the Gantt Chart. When an activity slips or starts later than planned, the scheduler often adds a notebook topic to the impacted activity, detailing the reason for the late start in the Notebook Topic description field. This information, while critical, is not easily viewed in the Gantt Chart.
This month’s tech tip will explain how to add the Notebook Topic description to activity bars in the Gantt Chart, further enhancing the effectiveness of this project layout.
The simple schedule detailed below contains 3 activities, all of which have been started and completed later than the Baseline Planned Dates.
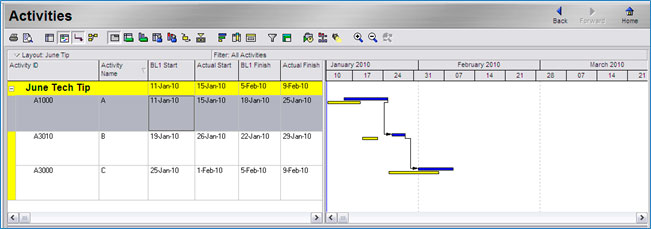
The yellow bars in the Gantt Chart represent the Planned Baseline Duration of the activity. The blue bars represent the Actual Start and Finish Dates. This view in the Gantt Chart does not offer the user any intelligence as to why the activities have slipped.
Each of the activities in this schedule has a “Delay Impact” Notebook Topic assigned, including a description explaining the reason for the late start and finish. The activity below, A1000, has been assigned a Notebook Topic of Delayed Impacts with a description of Rain Delay.
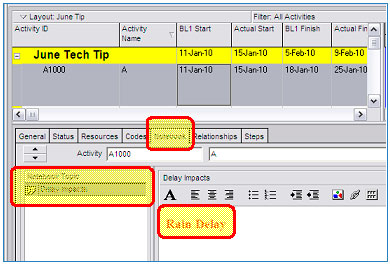
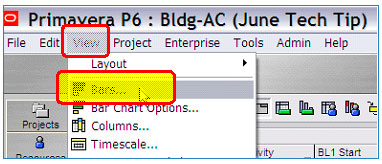
In order to view the Notebook Topic description (Rain Delay) in the Gantt chart, we must add the Notebook Topic as a bar label to one of the bars on the Chart. The first step to adding or editing bar labels is opening the Bars dialog box.
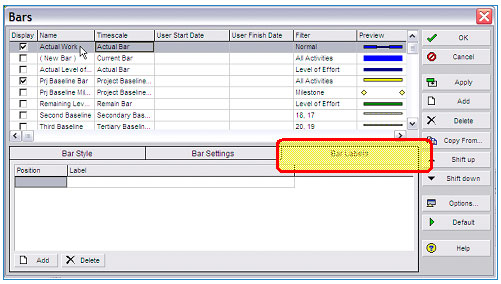
- From the Activity Window, select View, Bars.
- Select the Bar that will display the Notebook Topic description text. In this example, I select the Actual Bar.
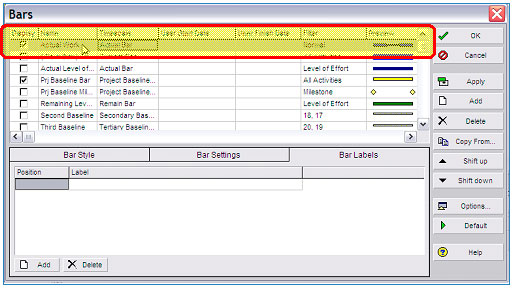
For this specific task, I suggest displaying only the Actual Work and Project Baseline Bars. Minimizing the number of bars shown in the Gantt Chart will prevent any text overlapping issues frequently encountered when displaying more than 3 bars.
- With the actual bar highlighted (shown below in grey), select the Bar Labels tab.
- Select Add, verify the Position is set to Right and click the down arrow to select the appropriate
Label.
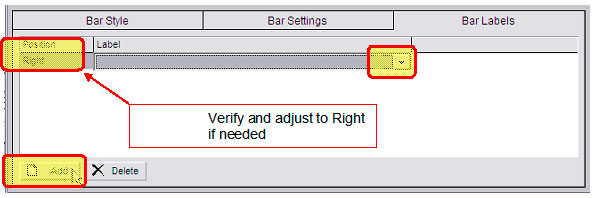
- Choose Notebook – Delay Impacts from the dropdown menu and click OK.

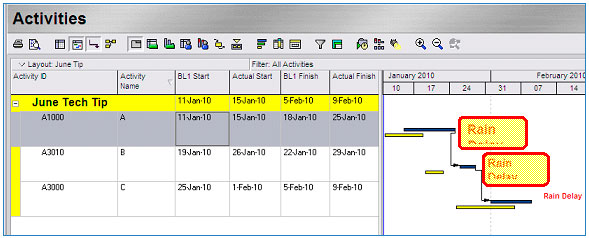
- Depending on the font type used in the Notebook Topic description or the row height in your Activity Table, the Bar Label in the Gantt Chart may be truncated. Row heights may be easily adjusted by selecting View, Table Font and Row and manually setting the default row height.
The example below shows how three different font sizes may result in the bar labels being cut off.
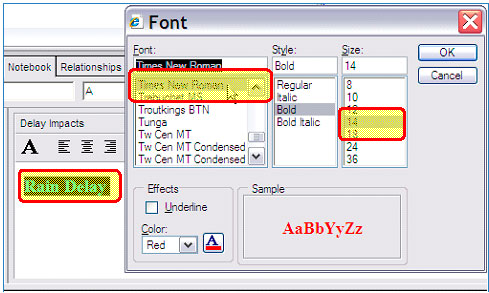
This may be corrected by changing the font size or type in the Notebook Topic description field to a smaller font type as shown below.
You may also adjust the size of the bar label text box to accommodate the size and font style you’re using in the Notebook Topic description field. To adjust the size of the text box in the Gantt Chart;
- Drag your mouse cursor over the bar label text field in the Gantt Chart until a black box appears around the bar label text.
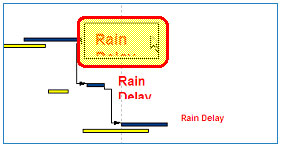
- Slowly drag your cursor to the right until the black box disappears and you see a double arrow.
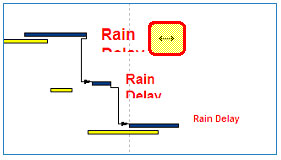
- While you can still see the double arrow, Left click and hold down the left click button while dragging the mouse to extend the size of the box. The text in the box will temporarily disappear while you are resizing the box.
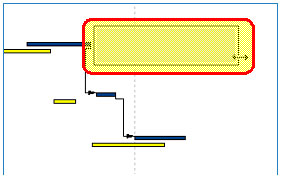
- Release the left click button when you have resized the box.
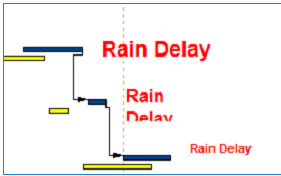
Save the customization of your bar labels as a layout for future use on this and other projects.
