Unit Forecasting
DRMcNatty developed an automated procedure for forecasting a critical program metric used in executive reports to monitor overall performance of a large portfolio.
DRMcNatty developed an automated procedure for forecasting a critical program metric used in executive reports to monitor overall performance of a large portfolio.
The client portfolio consisted of over 700 utility company projects annually that were tracked mainly by miles of pipe (“units”) installed throughout the year. This was a critical metric that was reported at executive levels and to regulatory agencies. The portfolio was separated into specific types of construction and overseen by a program manager. The overall annual total metric for miles of pipe installed was definitive but the projects in the portfolio varied significantly throughout the year. The program manager utilized side spreadsheets to compile the data of current projects, actual and remaining units to forecast over time based on personal judgments. However, it was often unclear how the results were compiled from a detailed project level.
There were 2 separate systems that contained the necessary data for forecasting: (1) The accounting system of record containing the units data and (2) P6 schedules that have the detailed construction dates for all major projects. One challenge was that analysts who maintained the P6 schedules were not versed in using P6 resources on the schedules, and with such a large number of projects, maintenance of resource data in the detailed P6 schedules was impractical. Also, the project portfolio was constantly changing. Thus, the units installed forecast needed to be updated to reflect the current list of projects. Another challenge was that P6 did not contain schedules for all of the portfolio projects; as smaller projects did not have or warrant a full P6 schedule.
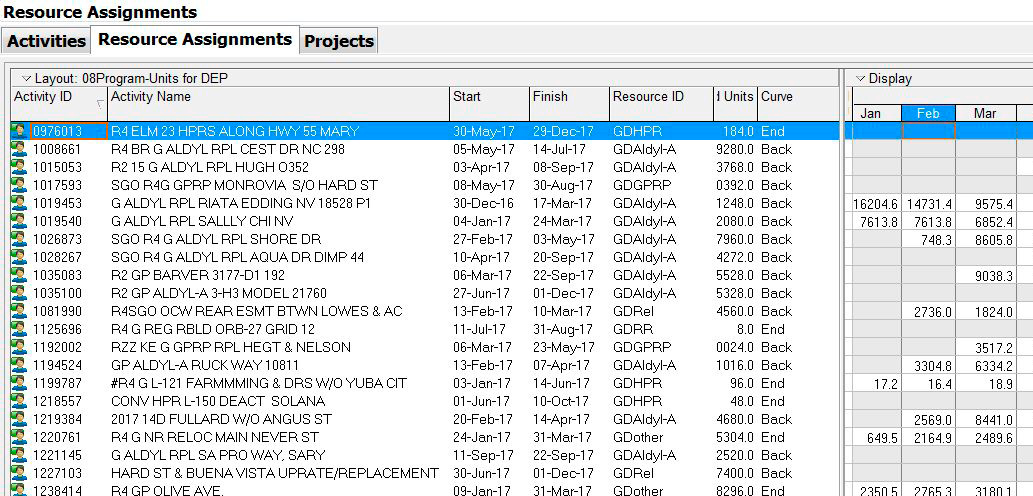
DRMcNatty created a single “consolidated” P6 schedule with data imported from the accounting system (planned and actual units installed) combined with data from the detailed P6 schedules (construction dates). Then, at month end, the necessary data from the detailed P6 schedule and the accounting system could be imported via flat file in to the single P6 schedule. The unit data was imported into a P6 resource, whie custom P6 curves were developed from historical data and used to distribute remaining units. Programming was developed to filter and make date adjustments for projects that were not in the correct time frame.
A table was created listing the 700+ projects along with the miles of pipe installed during the current month with a monthly forecast of the remaining units distributed for the remainder of the year. The monthly forecast values were distributed using the appropriate P6 curve utilizing the P6 resource assignments window. Holidays and specific month end dates were accounted for by P6 calendars. The entire unit forecast was produced within 4 hours of receiving the data from accounting. The list was sorted and subtotaled by the client construction programs and this data drove program graphs of planned, actual and forecast units. The net result was an executive summary metric of the entire portfolio that could be easily reviewed. The procedure delivered consistent, reliable information on the projects, and displayed summary information backed by the current status.
